mohsen alinia / Perfil
I am Trader And Programer (MQL)
site: http://WWW.TopTraderS.ir
site: https://WWW.TopMQL.com
Instagram: @TopTraderS.ir
Telegram: https://t.me/WWWTopTraderIR
site: http://WWW.TopTraderS.ir
site: https://WWW.TopMQL.com
Instagram: @TopTraderS.ir
Telegram: https://t.me/WWWTopTraderIR
mohsen alinia
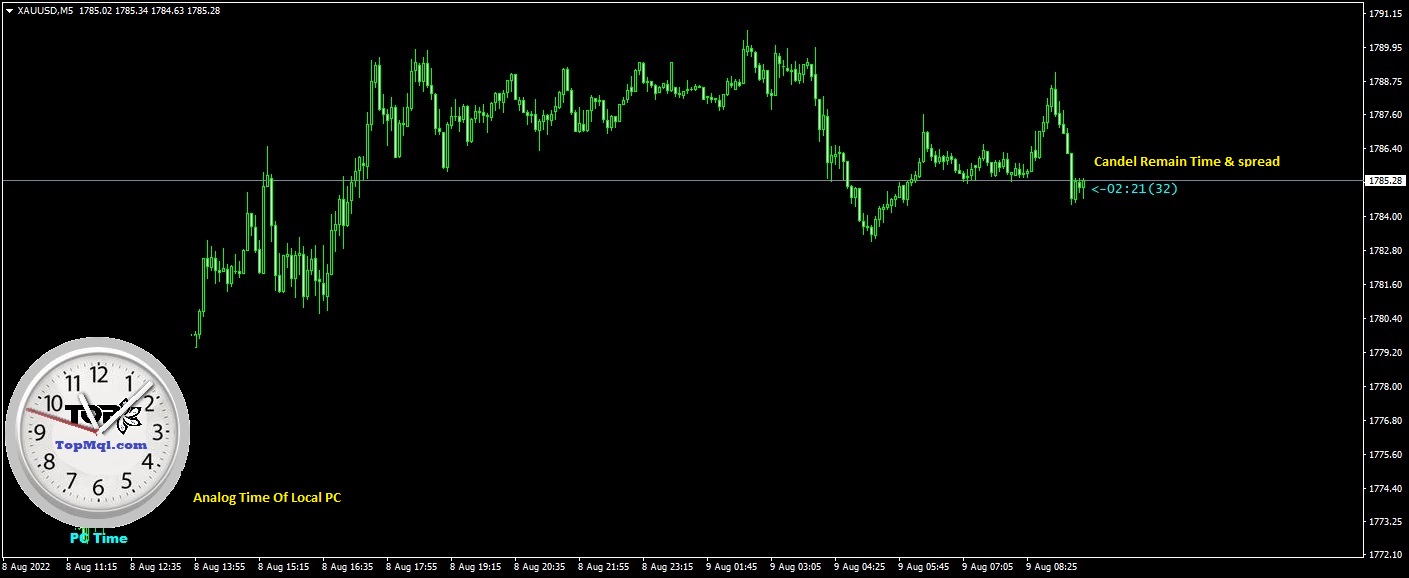
FREE TopClock Indicator:
This indicator is an Analog Clock That Shows:
Local Time Of Pc or Time Of Broker Server or sessions(Sydney -Tokyo London -NewYork)Time or custom Time( with GMT -Base)
this can show Candle Time Remainer with Spread live.
Download FREE from This Link:
https://www.mql5.com/en/market/product/85501
This indicator is an Analog Clock That Shows:
Local Time Of Pc or Time Of Broker Server or sessions(Sydney -Tokyo London -NewYork)Time or custom Time( with GMT -Base)
this can show Candle Time Remainer with Spread live.
Download FREE from This Link:
https://www.mql5.com/en/market/product/85501

mohsen alinia
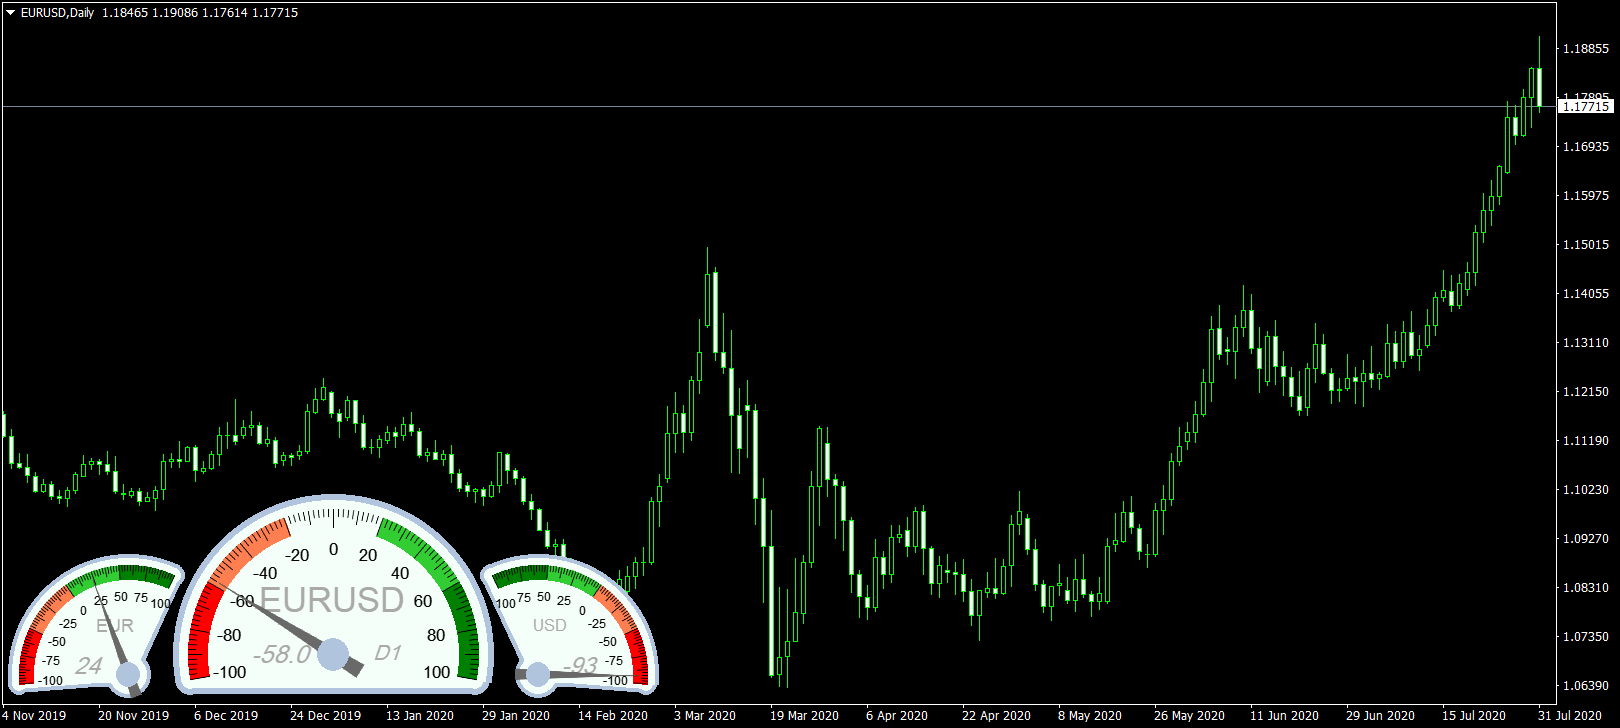
Comming Soon....
This is The Currency Strongs For Currency with new Method
Telegram ID: @TopMqlAdmin for more Information
This is The Currency Strongs For Currency with new Method
Telegram ID: @TopMqlAdmin for more Information

mohsen alinia
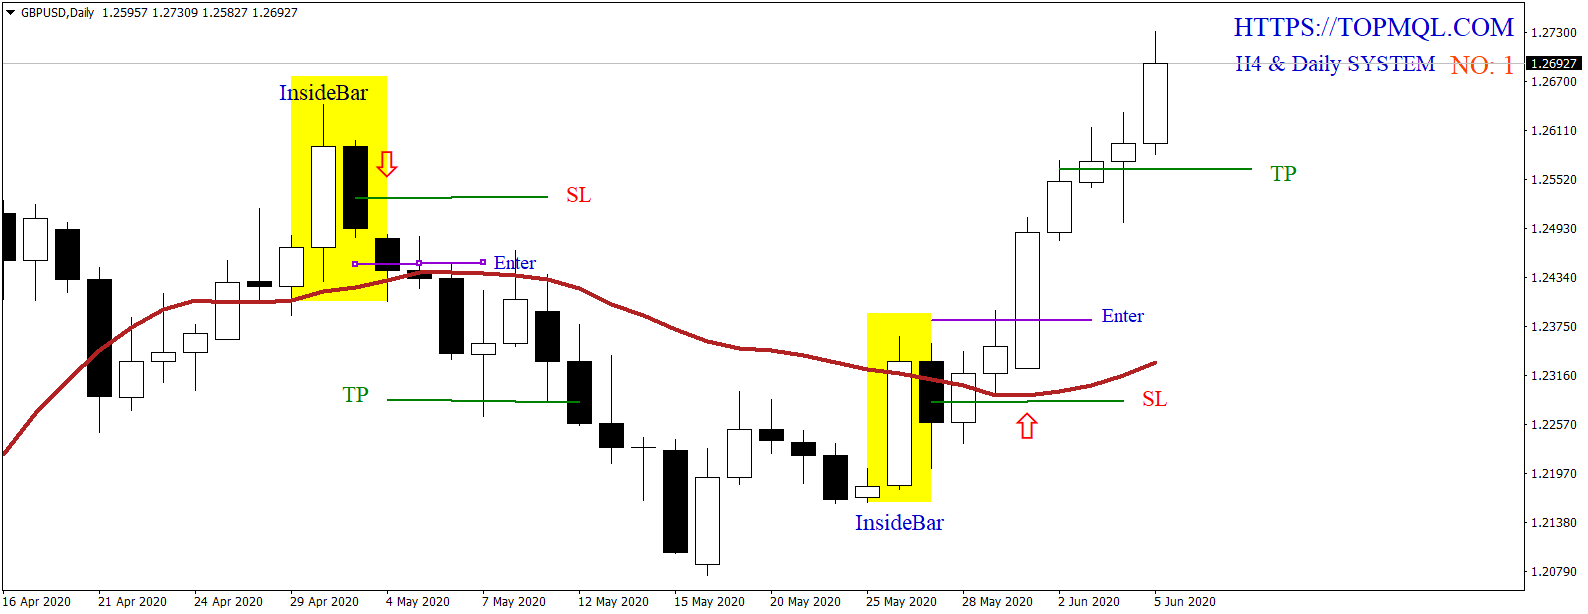
4H & DAILY TRADING SYSTEM # 1
Time Frame: Daily Indicator: 21 SMA Entry Rule: Identify if the trend is up or down by looking at 21 SMA. The trend is up if 21 SMA is pointing upward and the trend is down if 21 SMA is pointing downward. Entry is based on inside Bar. What is inside bar ? Inside Bar - the high point of the bar is lower than the previous day's high, and the low point is higher than the previous day's low. Look at the picture:
Once we have an inside bar present we will place a pending position, 5 pips above the high of the inside bar + spread if the trend is up on the 21 SMA indicator and 5 pips below the inside bar + spread if the trend is down on the 21 SMA indicator .
Stop Loss:
EURUSD 50 pip
USDCHF 50 pip
AUDUSD 50 pip
GBPUSD 60 pip
USDJPY 50 pip
USDCAD 60 pip
EURJPY 90 pip
GBPJPY 100 pip
Take Profit:
The take profit for any trade on any currency pair with this system is always double the value of the stop

mohsen alinia
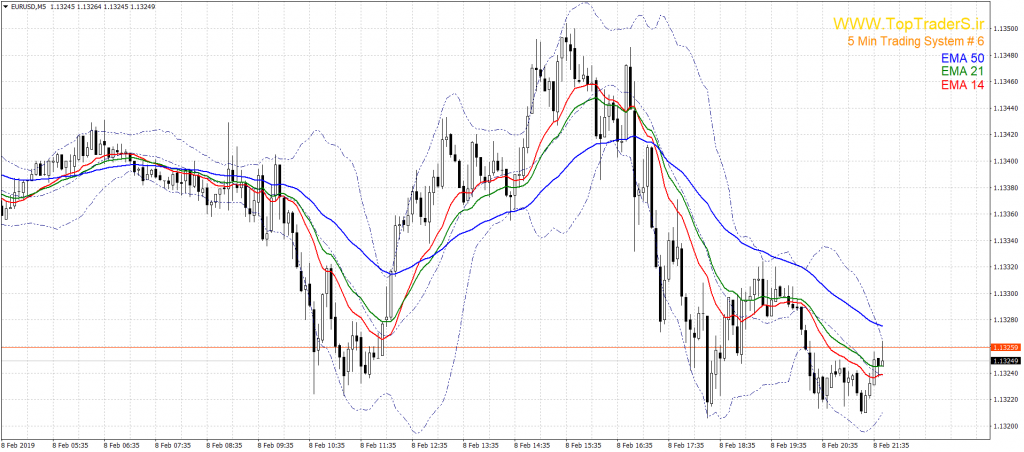
5 Min Trading System # 5
Pairs:
EUR/USD
Setup
This forex strategy requires 2 charts open simultaneously. Remember to wait till the
previous 5 minute bar closes before placing a trade, or closing any open trades.
5 minute chart:
EMA (14)
EMA (21)
EMA (50)
Bollinger Bands (20, 20)
1 hour chart:
EMA (14)
EMA (21)
EMA (50)
Bollinger Bands (20, 20)
BUY Entry
5 minute chart:
EMA (14) > EMA (21)
EMA (21) > EMA (50)
EMA (50) is within the Bollinger Bands
1 hour chart:
EMA (14) > EMA (21)
EMA (21) > EMA (50)
EMA (50) is within the Bollinger Bands
Current bar is touching EMA (14) or EMA (21)
Current bar closing price is above opening price
Place a BUY trade if all the above conditions are met on both the 5 minute chart andhour chart. Wait for the 5 minute bar to close before taking the trade.
SELL Entry
5 minute chart:
EMA (14) < EMA (21)
EMA (21) < EMA (50)
EMA (50) is within the Bollinger Bands
1 hour chart:
EMA (14) < EMA (21)
EMA (21) < EMA (50)
EMA (50) is within the Bollinger Bands
Current bar is touching EMA (14) or EMA (21)
Current bar closing price is below opening price
Place a SELL trade if all the above conditions are met on both the 5 minute chart andhour chart. Wait for the 5 minute bar to close before taking the trade.
EXIT
Exit the trade if the following conditions are no longer met on both the 5 minute and
hour chart:

mohsen alinia
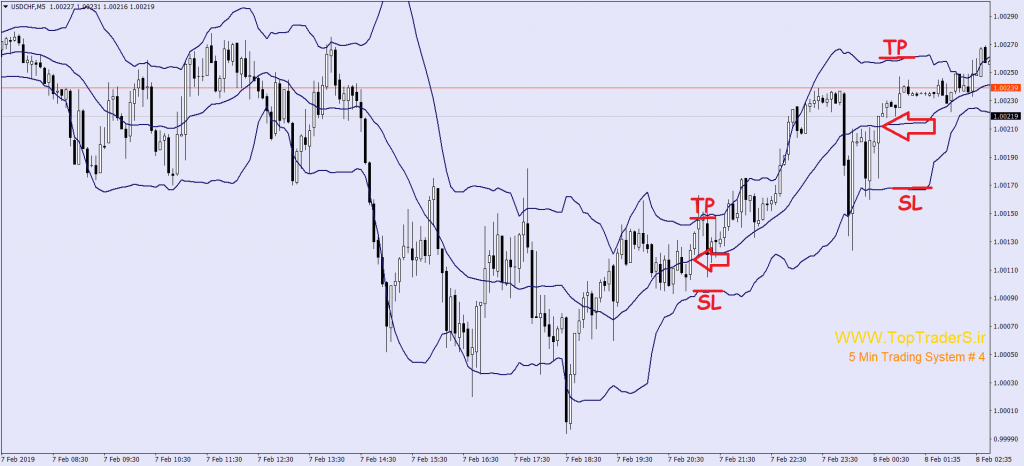
5 Min Trading System # 4
Pairs:
EUR/USD, GBP/USD, GBP/JPY
Indicators:
Bollinger Band (20,2)
Rules For Long Trades:
Bollinger band must slope up
Go long when the price touches the middle bollinger band from above
Stop loss at lower band or 15 pip
Take profit at upper band
Rules For Short Trades:
Bollinger band must slope down
Go short when the price touches the middle bollinger band from below
Stop loss at upper band or 15 min
Take profit at lower band.

mohsen alinia

5 Min Trading System # 3
Pairs:
EUR/USD, GBP/USD, USD/JPY, USD/CHF
Indicators:
Bollinger Band (20,2)
Stochastic (5,3,3)
Trading Rules:
A close must happen outside the bollinger band.
Stochastic oscillator must be in oversold area (below 20) or overbought area
(above 80)
If market is in uptrend, look for a red candle. If market is in a downtrend, look for
a green candle. We will call these the “signal candle”.
Once you see your signal candle, enter in that same direction and aim for 10 pips.
Stop loss at 20 pips or according to your trading rules.

mohsen alinia

5 Min Trading system # 2
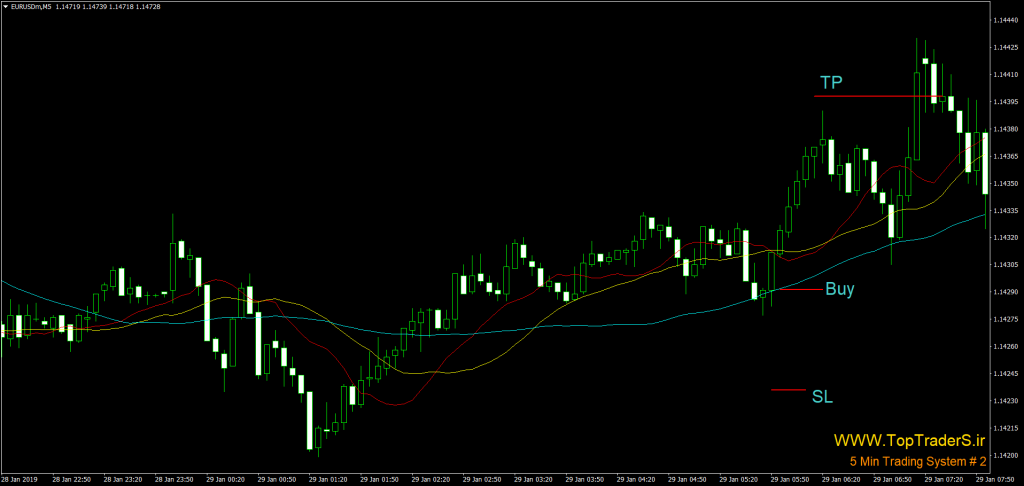
Pairs: EUR/USD Indicators: 10 EMA 21 EMA 50 EMA System Rules: Wait for a trend to shown on the 5 min chart, higher highs in an up trend and lower low in a down trend, look at the 50 EMA for trend strength and direction. Make sure you are not in the Asian session or at the end of the London or US session. Check there is no major upcoming news about to come out before you place a trade. Once price enters into the ZONE, wait for the pullback and open a trade, sell for down trend and buy for up trend. Set stop loss at 5 pips + spread Set take profit at 10 pips ZONE is the area between 10 EMA and 21 EMA. The 50 EMA is our gauge for the strength of the trend, in a good strong trend it should be pointing up or down at about 30 degrees from horizontal
Pairs: EUR/USD Indicators: 10 EMA 21 EMA 50 EMA System Rules: Wait for a trend to shown on the 5 min chart, higher highs in an up trend and lower low in a down trend, look at the 50 EMA for trend strength and direction. Make sure you are not in the Asian session or at the end of the London or US session. Check there is no major upcoming news about to come out before you place a trade. Once price enters into the ZONE, wait for the pullback and open a trade, sell for down trend and buy for up trend. Set stop loss at 5 pips + spread Set take profit at 10 pips ZONE is the area between 10 EMA and 21 EMA. The 50 EMA is our gauge for the strength of the trend, in a good strong trend it should be pointing up or down at about 30 degrees from horizontal

mohsen alinia

5 Min Trading System # 1
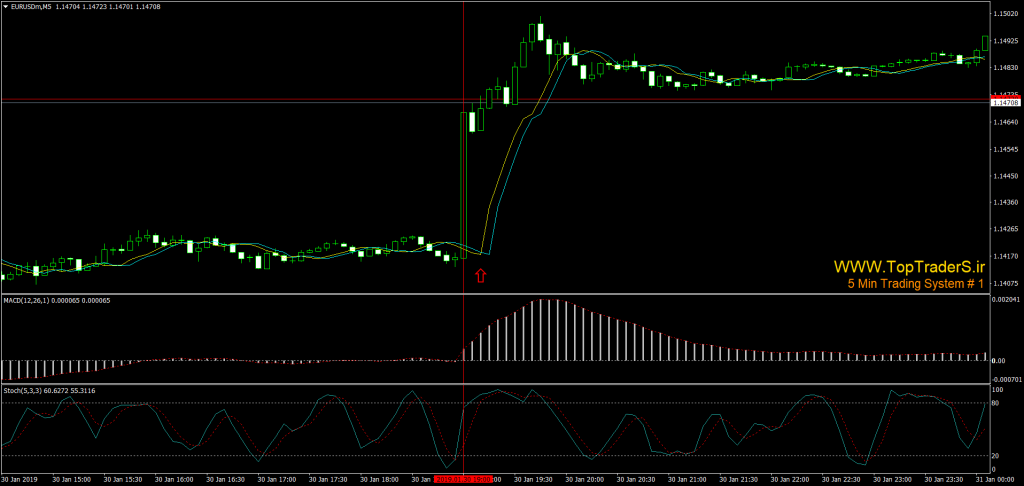
Pair: EUR/USD Indicators: MACD (12,26,1) Stochastic (5,3,3) EMA 5 to the close EMA 5 to the open Buy Signal: When the stochastic crosses up from the 20 line and is not overbought The MACD closses higher than the previous time interval The signal candle closes higher bullish The 5 EMA to the close has crossed the 5 EMA to the open Stop loss is 20 pips Close when the 5 EMA to the close has crossed the 5 EMA to the open Sell Signal When the stochastic crosses down from the 80 line and is not oversold The MACD closses lower than the previous time interval The signal candle closes lower bearish The 5 EMA to the close has crossed the 5 EMA to the open Stop loss is 20 pips
Close when the 5 EMA to the close has crossed the 5 EMA to the open

: