Thushara Dissanayake / Perfil
- Información
|
9+ años
experiencia
|
102
productos
|
102
versiones demo
|
|
5
trabajos
|
0
señales
|
0
suscriptores
|
Con más de 8 años de experiencia como programador y trader de Forex, he desarrollado más de 90 productos, con más de 1000 ventas hasta la fecha. Mi pasión por la automatización me impulsa a crear herramientas que capturan el conocimiento real del trading, con el objetivo de facilitar a los traders la toma de decisiones más inteligentes y rápidas.
Ofrezco una amplia gama de soluciones de trading para todo tipo de traders, desde principiantes que dan sus primeros pasos hasta profesionales experimentados que buscan herramientas de precisión. Cada producto que lanzo se somete a rigurosas pruebas de calidad y rendimiento, garantizando así el acceso a algunas de las herramientas más fiables e innovadoras disponibles en la actualidad.
Mi misión es simple: ayudar a los traders a crecer proporcionándoles las herramientas adecuadas y apoyo continuo. Siempre estoy disponible para responder a tus preguntas y ayudarte a sacar el máximo provecho de tu experiencia en el trading.
Únete a nuestra creciente comunidad de traders y descubre la diferencia que los robots, indicadores y aplicaciones de trading de Forex bien diseñados pueden marcar en tu éxito.
Canal: https://www.mql5.com/en/channels/forexrobotarmy
Chat: https://www.mql5.com/en/messages/010362012813dc01
GridFlux es un asesor experto (EA) de trading en rejilla diseñado para el trading automatizado en rejilla, el trading en rango y la gestión sistemática de posiciones . El EA divide el mercado en niveles de rejilla configurables, establece un marco estructurado de posiciones de compra y venta, y gestiona las posiciones a medida que el precio se mueve entre los niveles de la rejilla. GridFlux combina el espaciado de la rejilla, los niveles de la rejilla, la gestión automatizada de órdenes, la
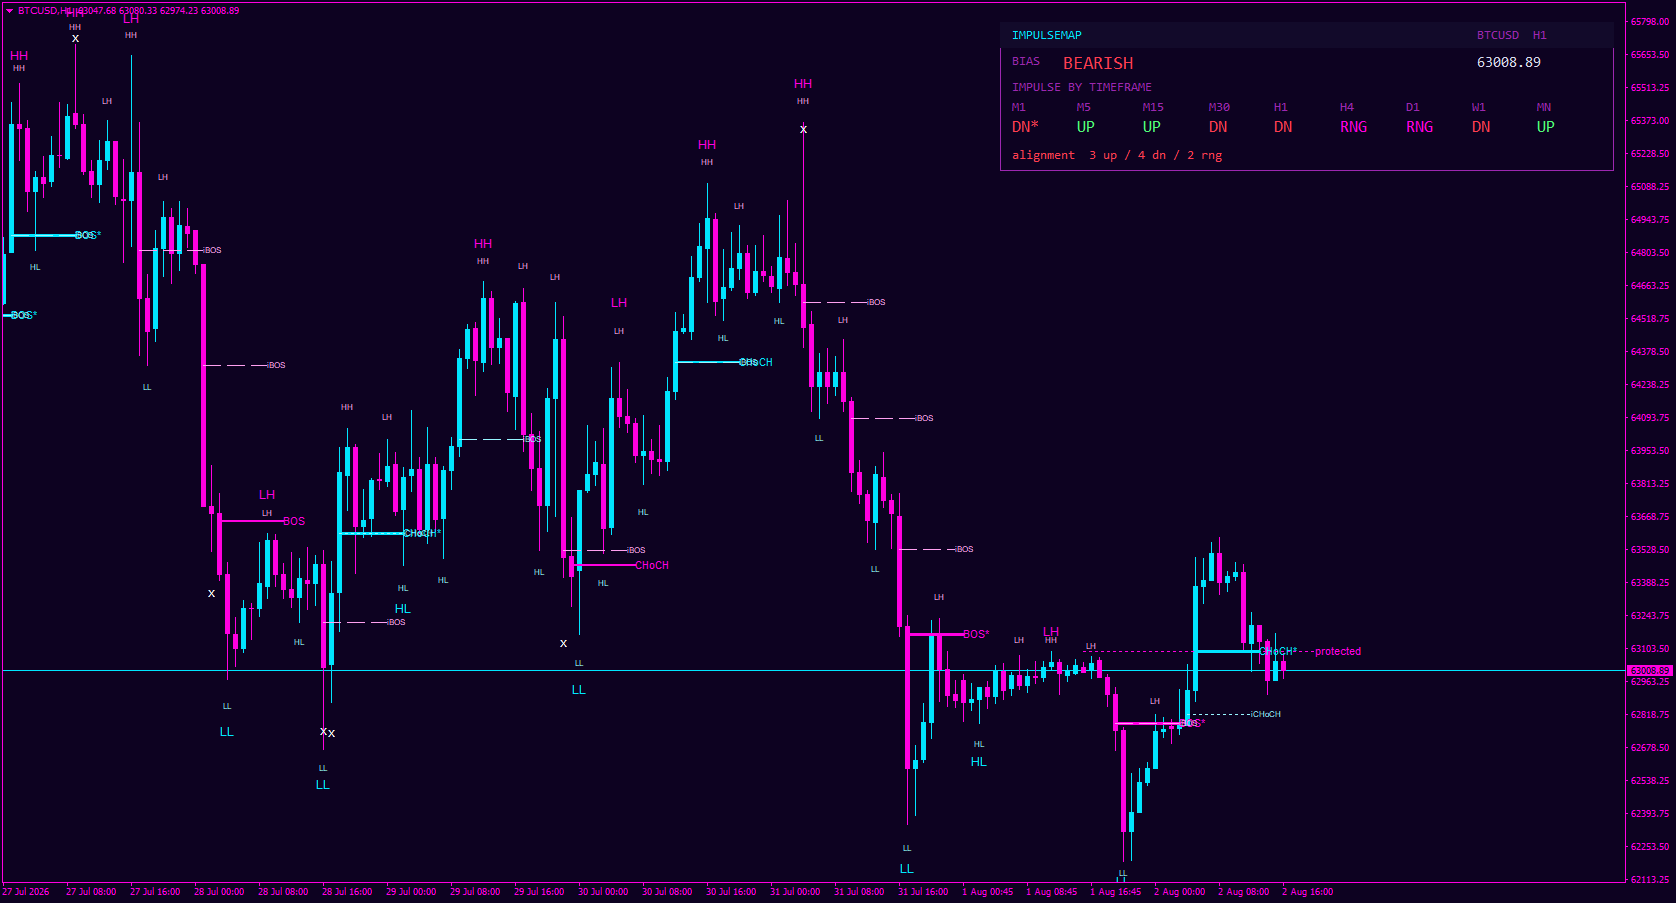
Mapa de impulsos es un Indicador de estructura de mercado para MT4 y MT5 que identifica y mapea automáticamente Máximos más altos (HH) , Mínimos más altos (HL) , Máximas bajas (LH) , Mínimos bajos (LL) , Rupturas de Estructura (BOS) , Cambios de carácter (CHoCH) y
I'm putting the finishing touches on my new market structure indicator, and I'm pretty excited to get this one into your hands.
It automatically maps the key structure levels that most traders spend hours drawing manually. HH, HL, LH, LL, Breaks of Structure (BOS), CHoCH, and Liquidity Sweeps - all plotted in real-time on MT4 and MT5.
The main goal? To give you an objective visual of where price actually is in the cycle, without the guessing game.
What you'll see in the first version:
- Clear structure labeling so you can identify shifts in momentum at a glance.
- A Multi-Timeframe Panel to check alignment across higher TFs instantly.
- Built-in tooltips that explain each event on the chart (great for those still mastering SMC/ICT concepts).
It's built for price action purists who want clarity, not clutter. Whether you're trading Gold, Forex, or Crypto, the logic stays consistent.
I'll be sharing the first full screenshot and release soon. Let me know below if this is something you'd add to your toolkit. 👇
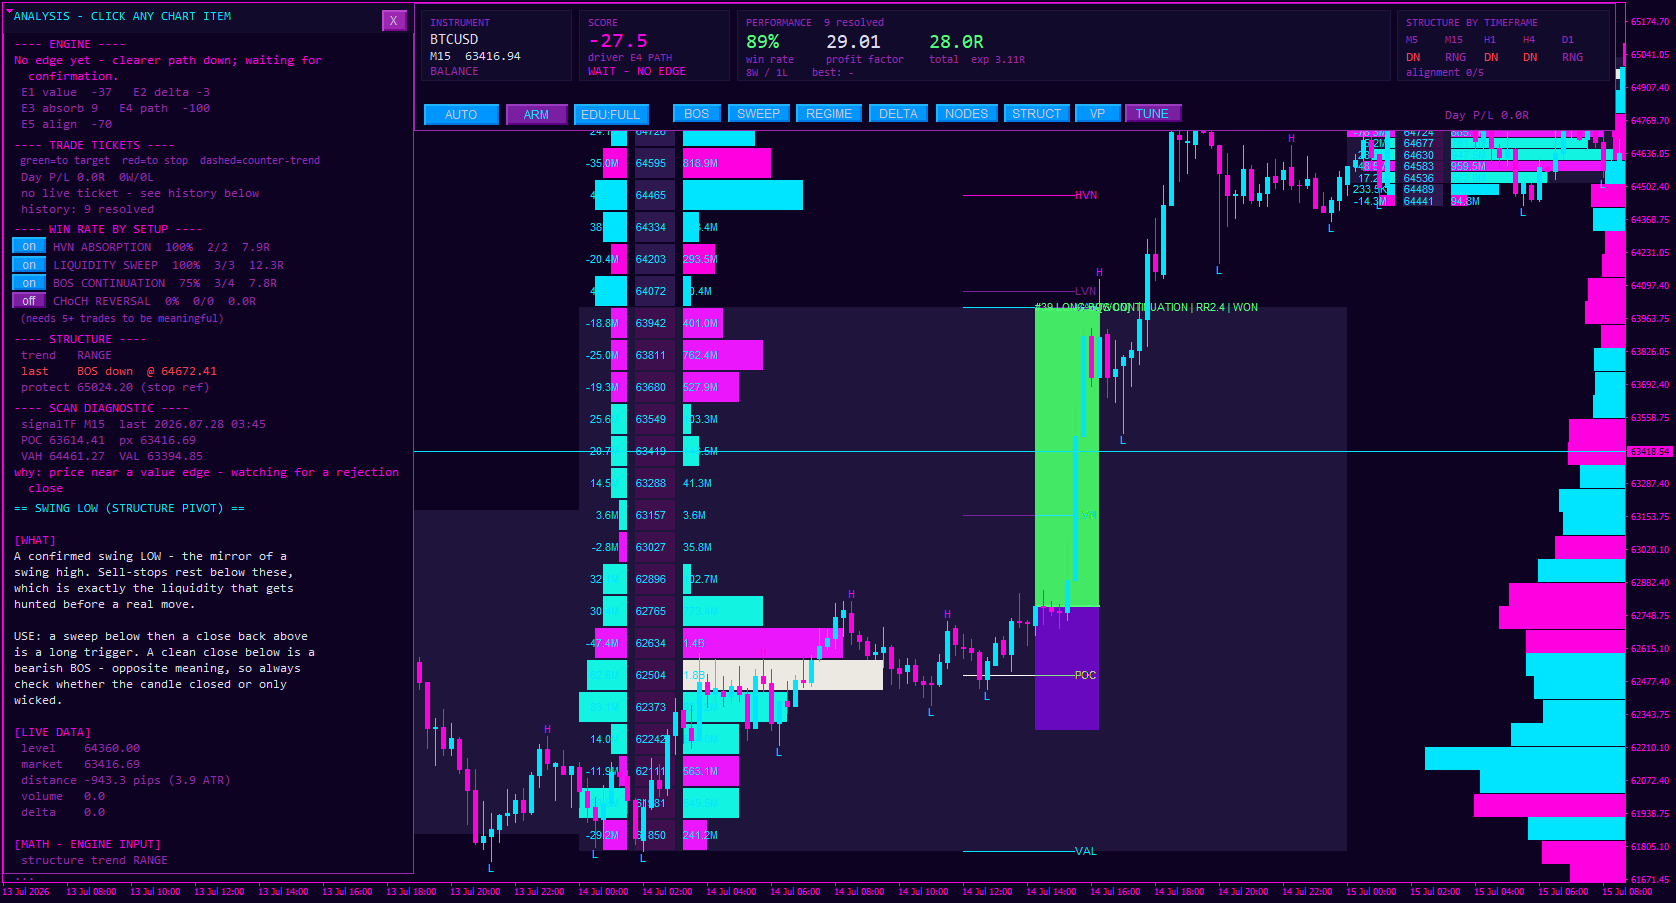
Estructura de flujo de subasta es un Indicador de perfil de volumen y estructura de mercado que combina Perfil de volumen , Análisis Delta , Estructura de mercado y transparencia motor de decisiones para ayudar a los operadores a evaluar posibles oportunidades de negociación utilizando evidencia objetiva del
AuctionFlow Structure coming soon.
If you trade auction theory, this one's for you. One intelligent workspace that brings together:
📊 Daily volume profiles
📍 Value areas
⚡ Delta
🏗️ Market structure
…all in one place. No more juggling five tools to read what the market's actually doing.
It also serves up scored trade tickets, so you can see the evidence behind each setup and weigh entries, exits, and risk with real market context, not gut feel.
This is the first screenshot I'm sharing, and I'm genuinely excited about this one. 🔥
Publishing soon. Follow so you're first in line when it drops, free demo will be available to try it yourself. ⚡
Candlestick Pattern Alert es un indicador de patrones de velas japonesas para MT4 y MT5 diseñado para detectar, clasificar y mostrar automáticamente más de 50 patrones principales de velas japonesas en tiempo real. Diseñado para el trading de acción del precio y el análisis técnico , el indicador escanea las velas completadas, identifica patrones de reversión alcistas y bajistas confirmados y patrones de
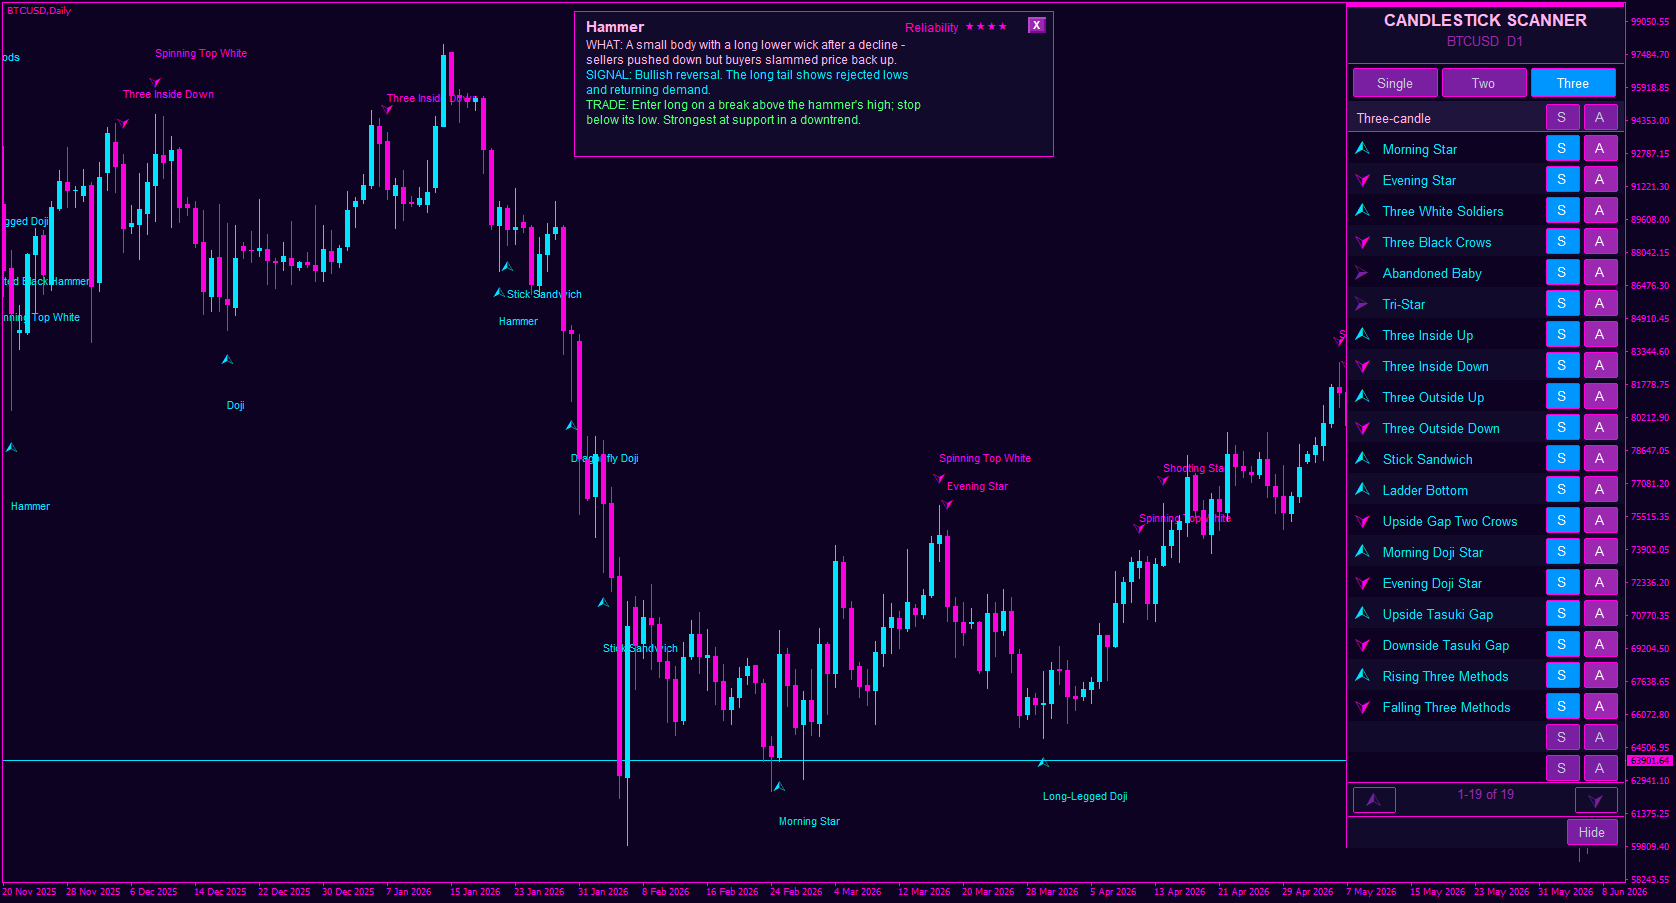
Two features I just added to the pattern detection dashboard:
⭐ Reliability meter - every pattern now shows a strength rating (★★★★☆) right on the card, so you know at a glance how much weight to give a signal. No more guessing which patterns actually matter.
📚 Learn mode - flip a switch and the dashboard cycles through every pattern one by one, like a mini tutorial built right into your charts. Learn the patterns while you trade.
I built these because I remember starting out and drowning in pattern names with no idea which ones to trust. This makes it click faster.
What patterns tripped you up when you were learning? Drop them below 👇 curious to hear.
Follow for the next update. 🔥
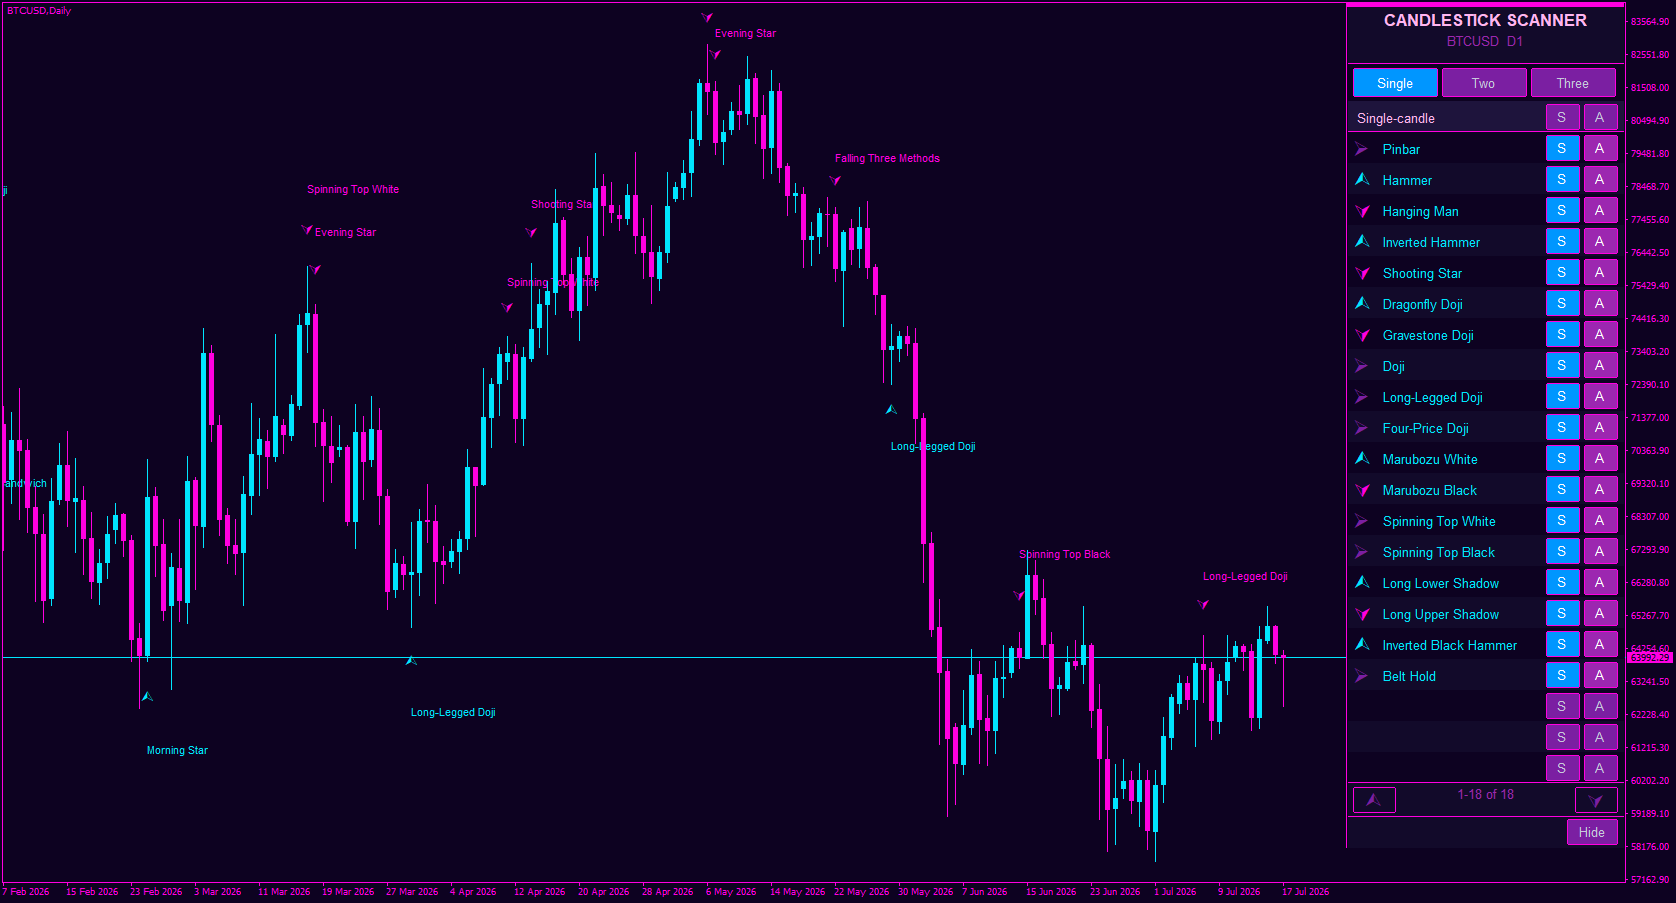
New candlestick pattern detection dashboard, spotting the patterns for you, right on the panel, so you're not squinting at charts trying to name what you're seeing.
This is the very first image I'm sharing. Still early, but it already looks this clean. 🔥
I've got a good feeling about this one.
What patterns would you want it to catch? Drop your must-haves below 👇 your input shapes what I build next.
Follow so you don't miss the next reveal. ⚡
Pivot Confluence Zones es un indicador de análisis técnico para MT4 y MT5 diseñado para identificar zonas de retroceso , áreas de reversión y niveles de soporte y resistencia mediante la combinación de Pivot Points , Fibonacci Retracement , ATR y ADR en un único espacio de trabajo de trading. En lugar de depender de una sola herramienta técnica, el indicador busca zonas
The update so many of you have been waiting for just went out and this is a big one. Everything you've been asking for over the last few weeks made it into this release.
If you've been sitting on the fence, now's the time to take a proper look. And if you already own it, the update is waiting for you. 🙌
Huge thanks to everyone who sent feedback and ideas along the way v2.0 is genuinely shaped by this community.
Check it out, load it on your charts, and tell me what you think. 👇 Free demo available as always, results may vary, but I think you'll like what you see. 🔥
Candle Power Pro es un indicador de análisis de volumen diseñado para analizar el volumen real de ticks , la presión alcista/bajista , los desequilibrios entre compradores y vendedores , y las relaciones precio-volumen directamente desde el gráfico. El indicador transforma la actividad del volumen de las velas en un sistema visual de análisis de mercado al mostrar los porcentajes de volumen alcista y bajista
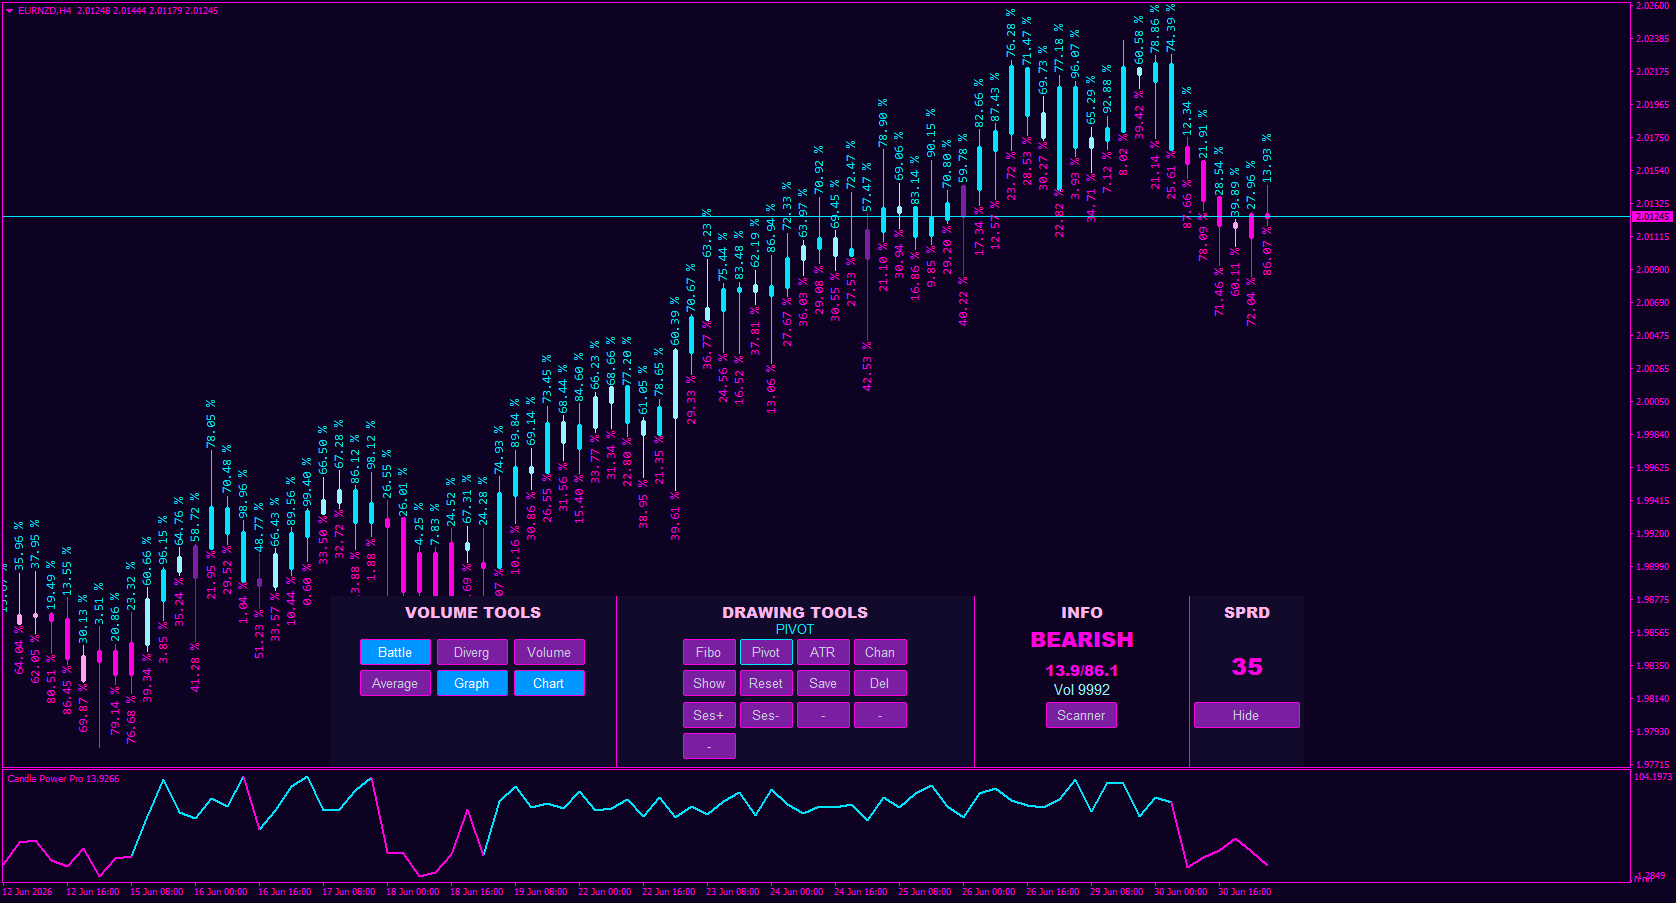
Candle Power Pro just got smarter. The updated Volume Spike algorithm now auto-detects high-volume candles and drops a 💣 bomb arrow right when a fresh trend kicks off. Look at the screenshot, every candle redraws by bull/bear percentage, and the moment a real volume spike hits, you see the signal clearly as a new trend opens (this one caught a sell). No guesswork, no squinting at volume bars.
This is the kind of edge I love building, simple to read, genuinely useful, and now fully automatic.
Want to see it live on your charts? Check out Candle Power Pro and grab the free demo. 👇 As always, results may vary, but the read is crystal clear.
Drop a comment if you'd run this strategy. 🔥
Take a close look at the dashboard and tell me what changed. First one to call it right gets bragging rights. 😏
Drop your guess below. 👇 I'll reveal it in the comments once a few of you have had a go.
Follow to catch the full update when it drops. 🔥
No name. No details. Just a look.
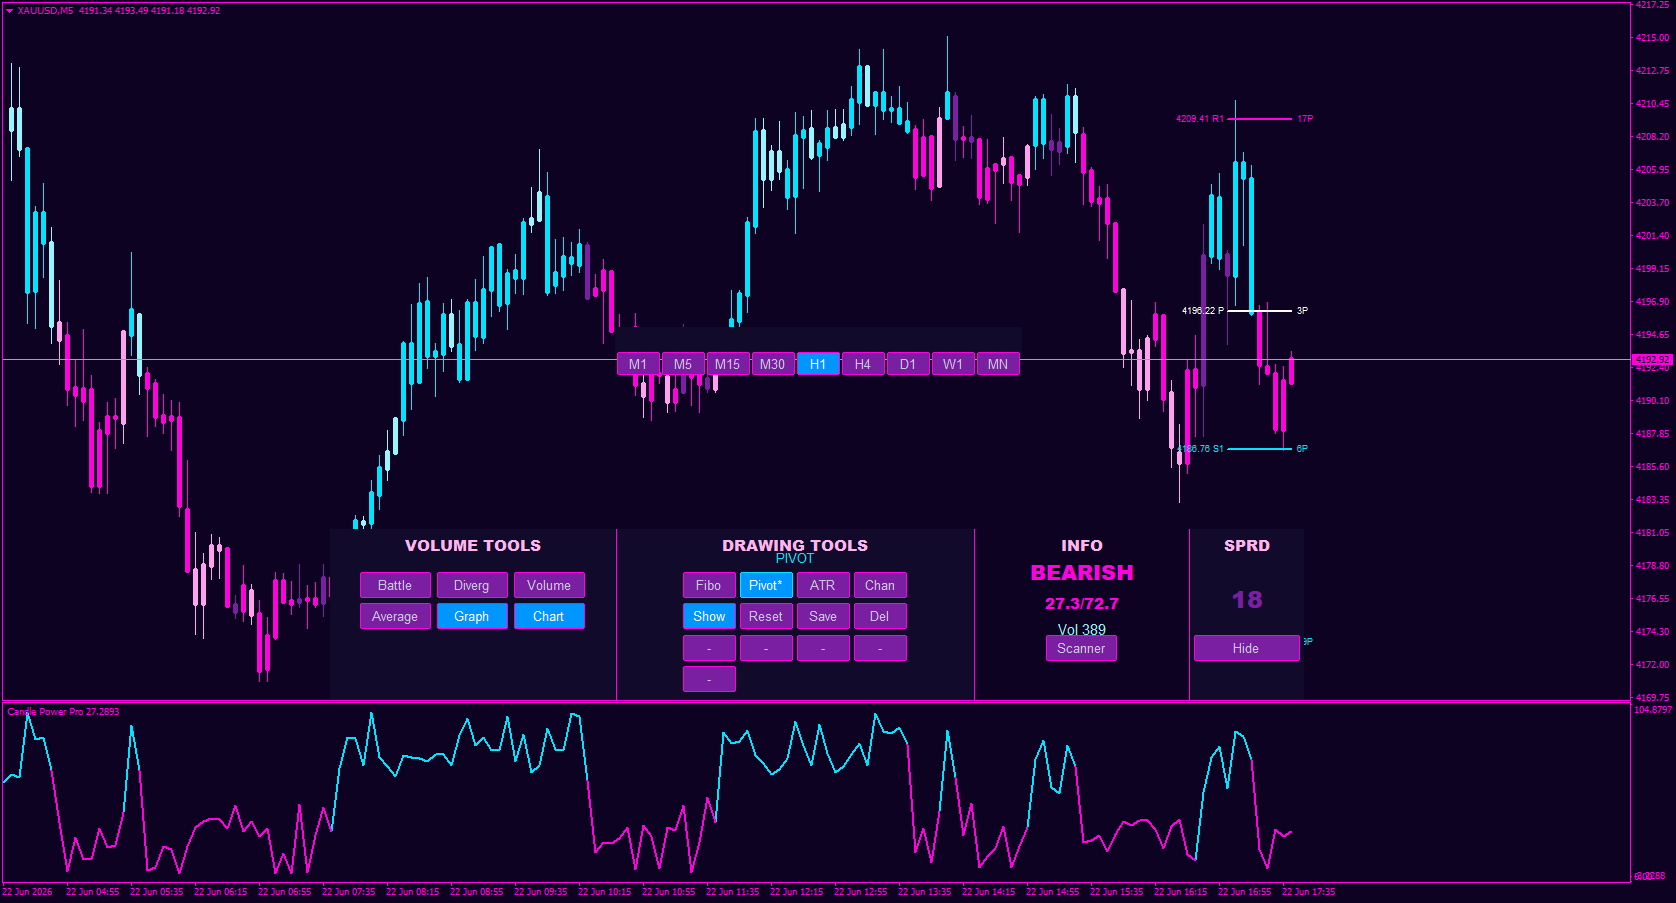
That cyber-synth glow, pivot levels mapped out, candle power signals sitting right behind your chart where you actually need them. All in one clean panel.
I'm obsessed with how this theme is coming together, but I want YOUR eyes on it.
What's the vibe? Does the design hit, or would you change something? Drop your honest take below. 👇
Something new is coming. Follow so you don't miss the reveal. ⚡
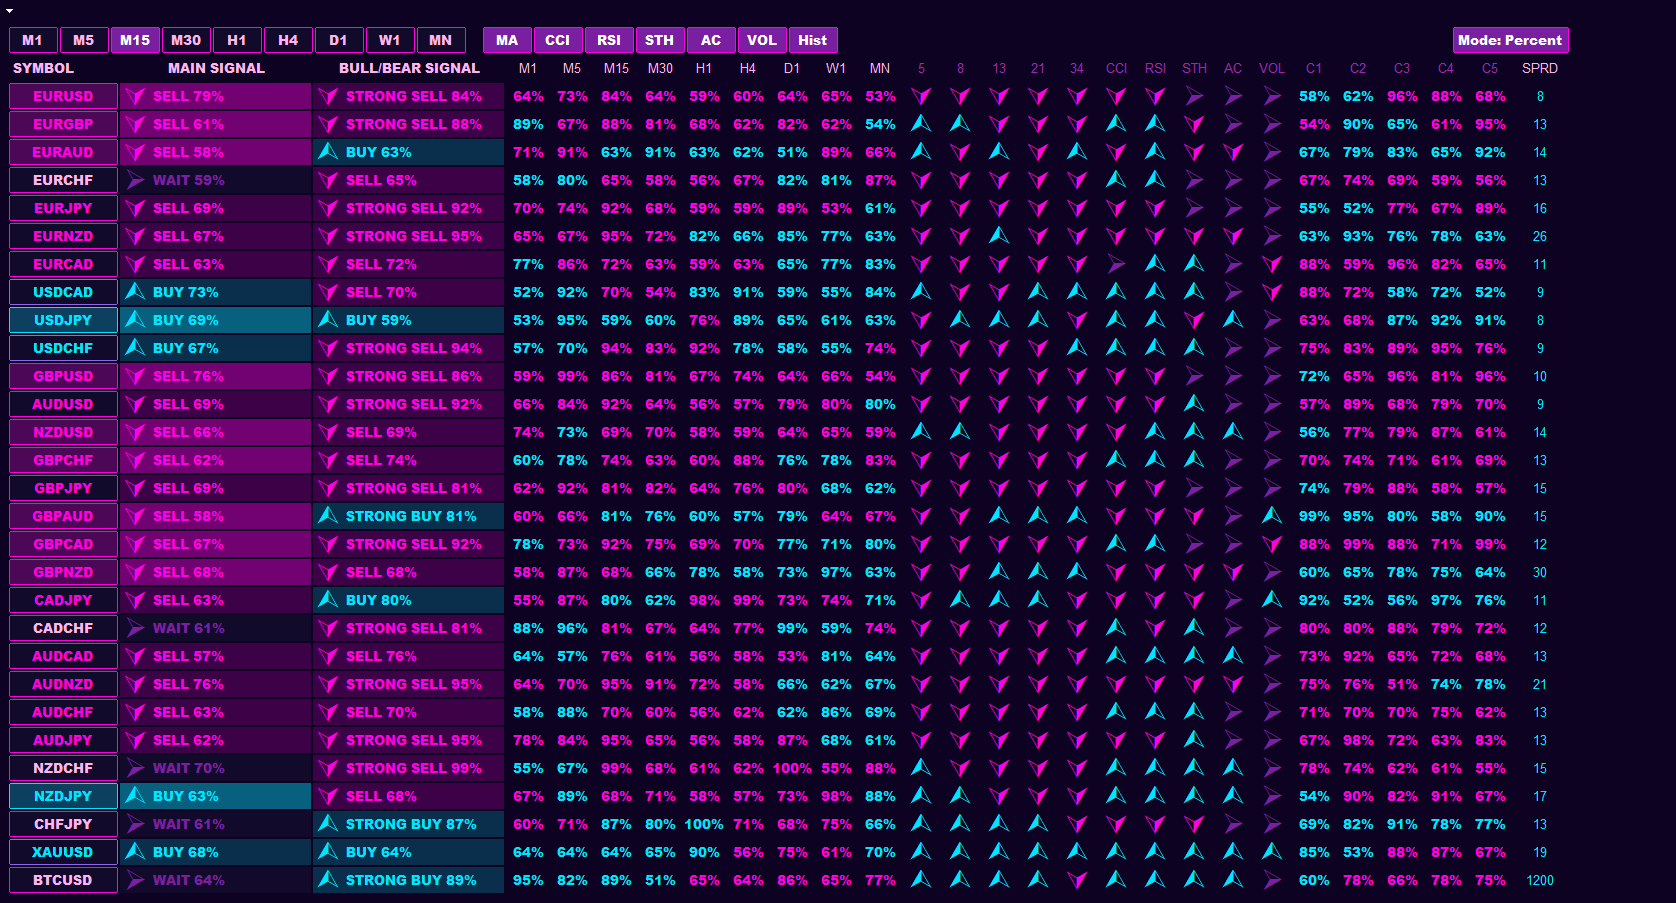
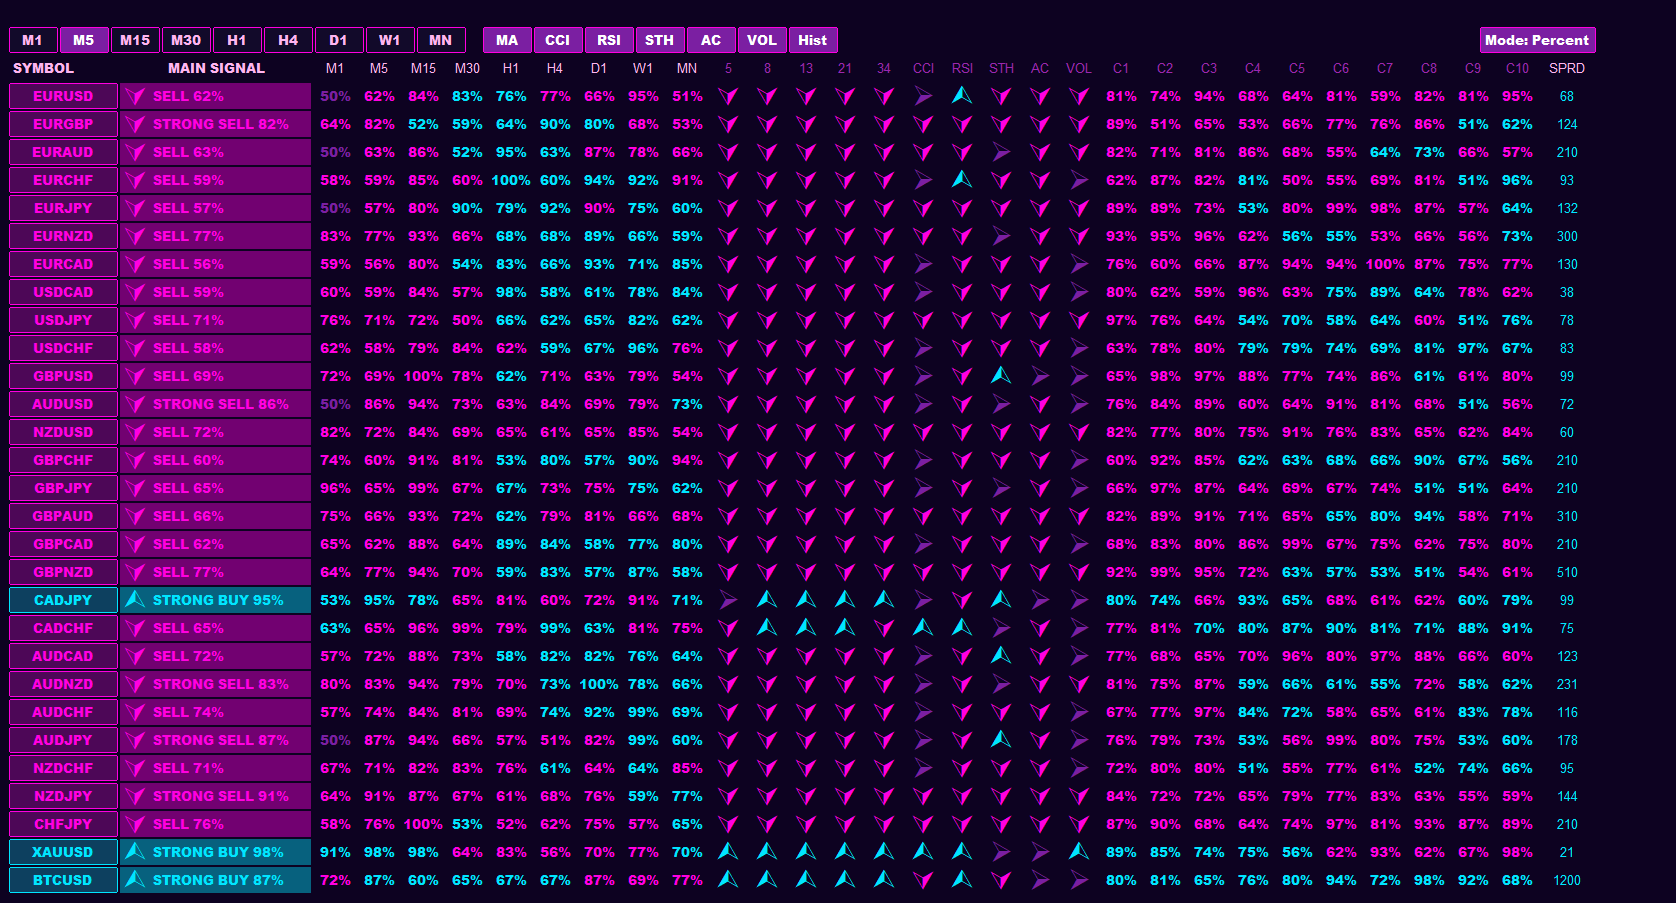
Candle Power Pro - Multisymbol Dashboard is finally taking shape.
One dashboard. All your symbols. All the candle strength data you need to read the market at a glance, no more jumping chart to chart trying to piece it together.
It's still under active development (not done yet, so be kind 😅), but it's at the point where I want to show it off and hear from you.
Here's my honest ask: take a look at this sneak peek and tell me what you think. What would make this a must-have on your charts? What's missing? Your feedback now actually shapes what ships.
Drop your honest review in the comments, good, bad, brutal. I read every one. 🙏
Follow to catch the release first.
Entry Point Dashboard Ultimate es un indicador de panel de control para trading multitemporal en MT4 y MT5, diseñado para simplificar el análisis técnico , el análisis de tendencias del mercado y la identificación de puntos de entrada , combinando diversas herramientas de trading en un único panel visual. El indicador analiza las medias móviles , el CCI , el RSI , el estocástico
Triple MA Crossover Alert es un indicador de cruce de medias móviles diseñado para analizar la dirección del mercado mediante una combinación de tres medias móviles: media móvil rápida , media móvil normal y media móvil lenta . Este indicador ayuda a los operadores a identificar cambios en la tendencia del mercado , posibles condiciones alcistas y bajistas , y áreas importantes de movimiento de precios a