Thushara Dissanayake / Profil
- Informations
|
9+ années
expérience
|
102
produits
|
102
versions de démo
|
|
5
offres d’emploi
|
0
signaux
|
0
les abonnés
|
Fort de plus de 8 ans d'expérience en tant que programmeur et trader Forex, j'ai développé plus de 90 produits et réalisé plus de 1 000 ventes à ce jour. Ma passion pour l'automatisation me pousse à créer des outils qui exploitent les connaissances du trading, afin de faciliter la prise de décisions plus rapides et plus éclairées.
Je propose une large gamme de solutions de trading adaptées à tous les profils de traders, des débutants aux professionnels expérimentés en quête d'outils de précision. Chaque produit que je lance est rigoureusement testé pour sa qualité et ses performances, vous garantissant ainsi l'accès à des outils parmi les plus fiables et innovants du marché.
Ma mission est simple : accompagner les traders dans leur progression en leur fournissant les outils adéquats et un soutien continu. Je suis toujours disponible pour répondre à vos questions et vous aider à optimiser votre expérience de trading.
Rejoignez notre communauté grandissante de traders et découvrez comment des robots de trading Forex, des indicateurs et des applications de trading performants peuvent booster votre réussite.
Chaîne : https://www.mql5.com/en/channels/forexrobotarmy
Chat : https://www.mql5.com/en/messages/010362012813dc01
GridFlux is an Grid Trading Expert Advisor (EA) designed for automated grid trading, range trading, and systematic position management . The EA divides the market into configurable grid levels , establishes a structured buy and sell position framework, and manages positions as price moves between grid levels. GridFlux combines grid spacing, grid levels, automated order management, range-market detection, ADX, Bollinger Bands, trend confirmation, pending-order controls, and daily profit and loss
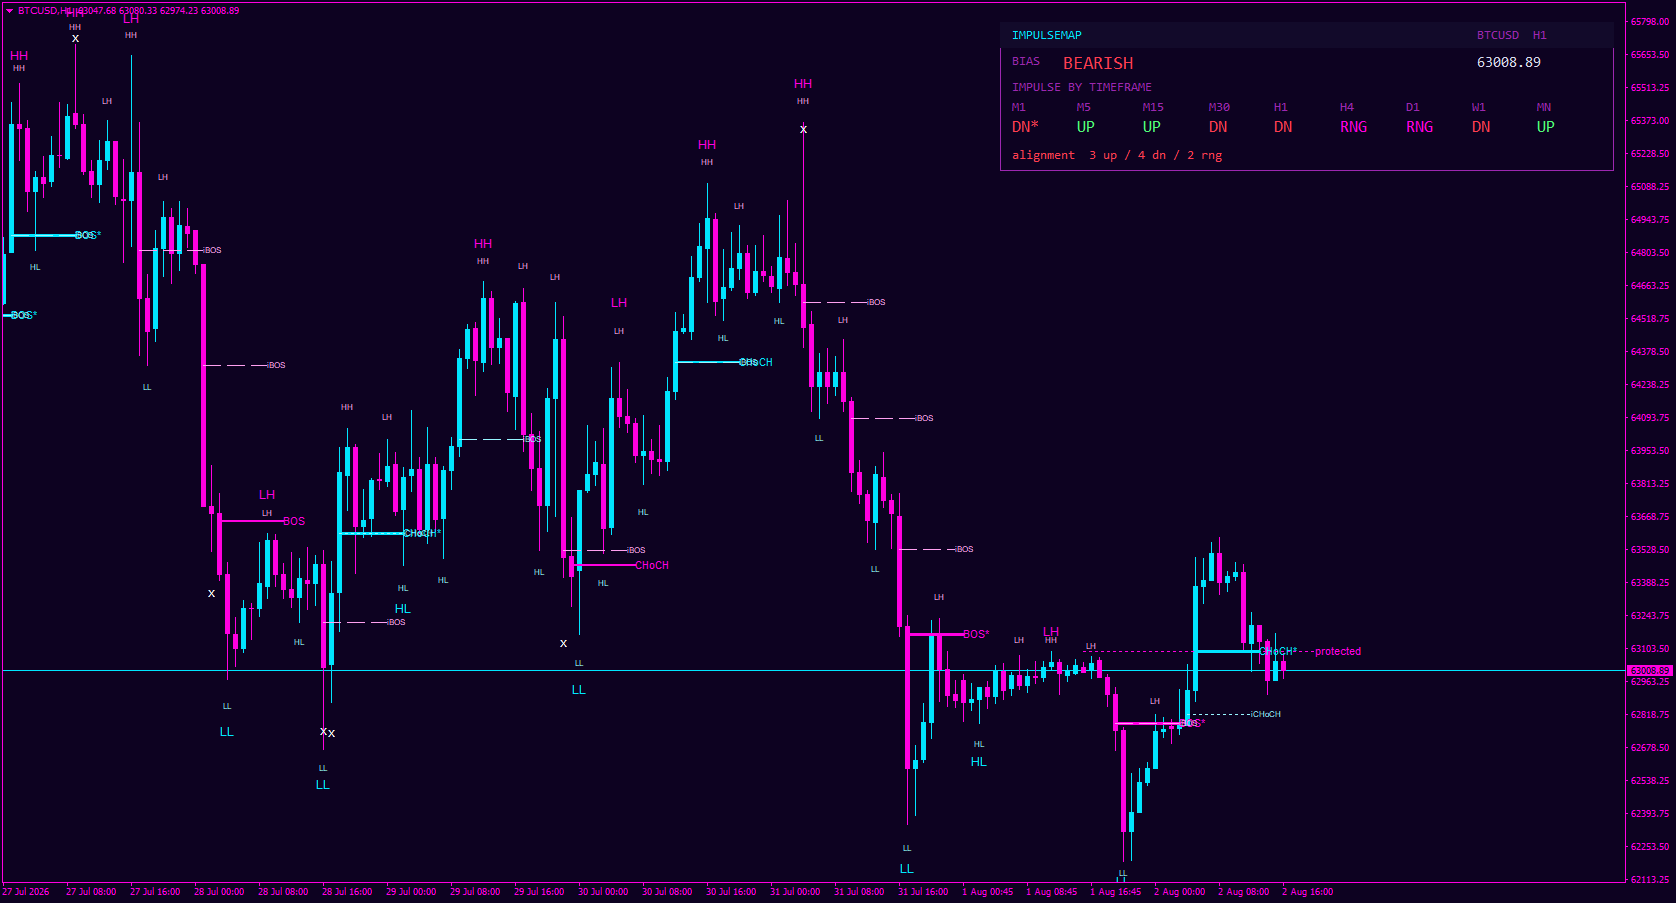
Carte d'impulsion est un Indicateur de structure de marché pour MT4 et MT5 qui identifie et cartographie automatiquement Niveaux élevés (HH) , Bas plus élevés (HL) , Hautes basses (LH) , Basses basses (LL) , Ruptures de structure (BOS) , Changements de caractère (CHoCH)
I'm putting the finishing touches on my new market structure indicator, and I'm pretty excited to get this one into your hands.
It automatically maps the key structure levels that most traders spend hours drawing manually. HH, HL, LH, LL, Breaks of Structure (BOS), CHoCH, and Liquidity Sweeps - all plotted in real-time on MT4 and MT5.
The main goal? To give you an objective visual of where price actually is in the cycle, without the guessing game.
What you'll see in the first version:
- Clear structure labeling so you can identify shifts in momentum at a glance.
- A Multi-Timeframe Panel to check alignment across higher TFs instantly.
- Built-in tooltips that explain each event on the chart (great for those still mastering SMC/ICT concepts).
It's built for price action purists who want clarity, not clutter. Whether you're trading Gold, Forex, or Crypto, the logic stays consistent.
I'll be sharing the first full screenshot and release soon. Let me know below if this is something you'd add to your toolkit. 👇
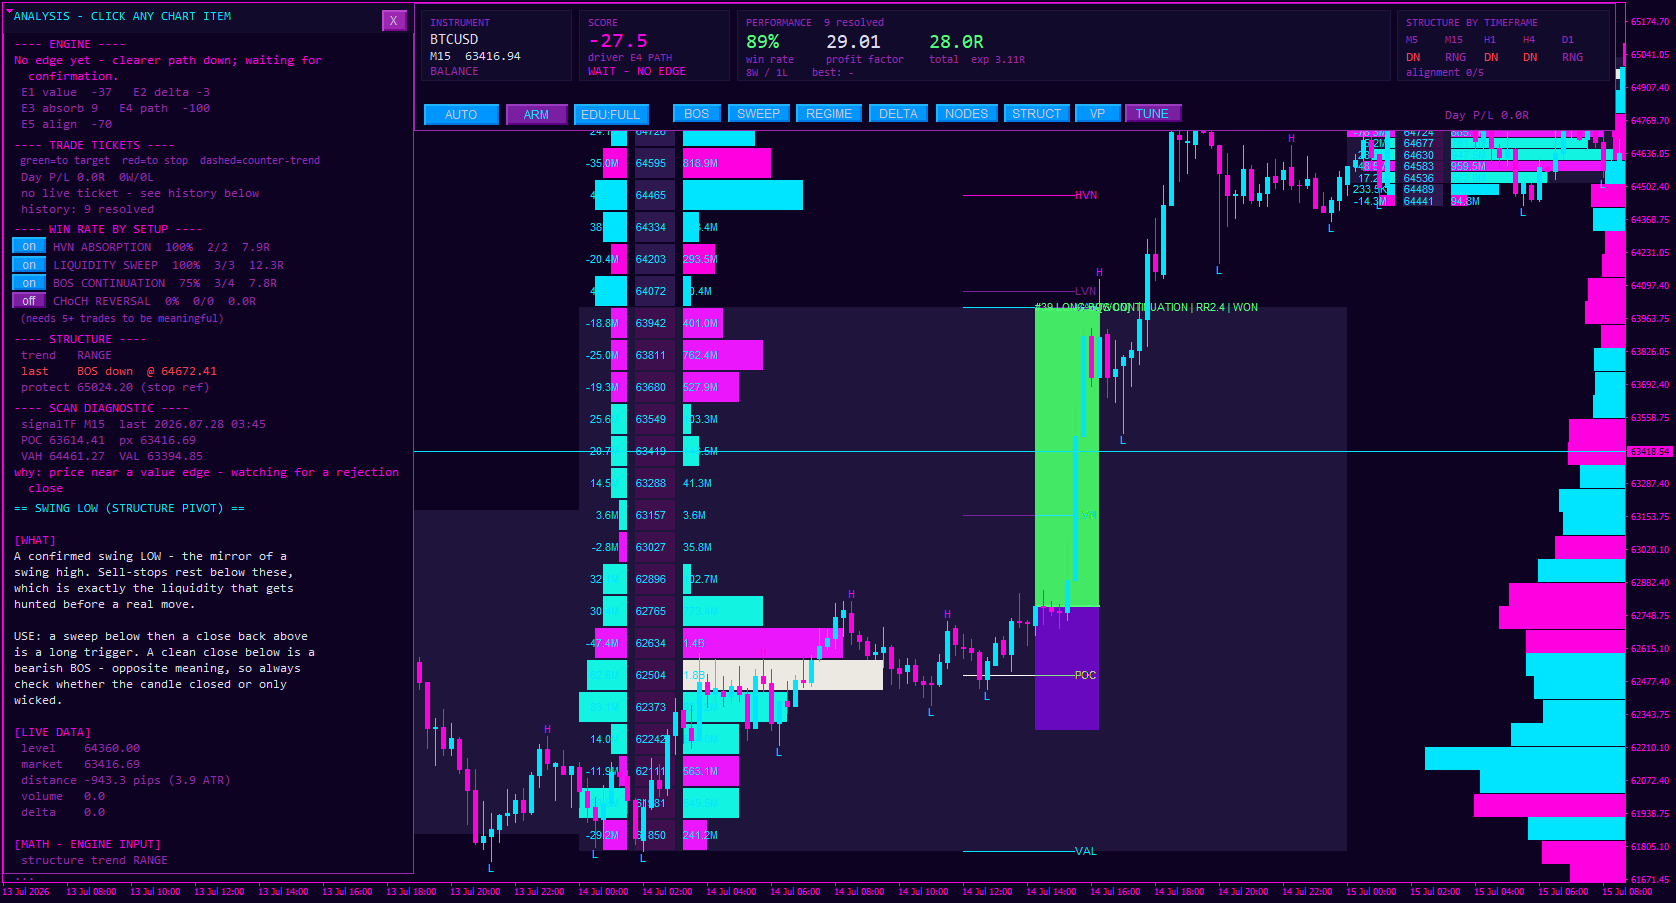
Structure du flux d'enchères est un Indicateur de profil de volume et de structure de marché qui combine Profil de volume , Analyse Delta , Structure du marché et transparence moteur de décision pour aider les traders à évaluer les opportunités de trading potentielles à l'aide de données objectives sur le
AuctionFlow Structure coming soon.
If you trade auction theory, this one's for you. One intelligent workspace that brings together:
📊 Daily volume profiles
📍 Value areas
⚡ Delta
🏗️ Market structure
…all in one place. No more juggling five tools to read what the market's actually doing.
It also serves up scored trade tickets, so you can see the evidence behind each setup and weigh entries, exits, and risk with real market context, not gut feel.
This is the first screenshot I'm sharing, and I'm genuinely excited about this one. 🔥
Publishing soon. Follow so you're first in line when it drops, free demo will be available to try it yourself. ⚡
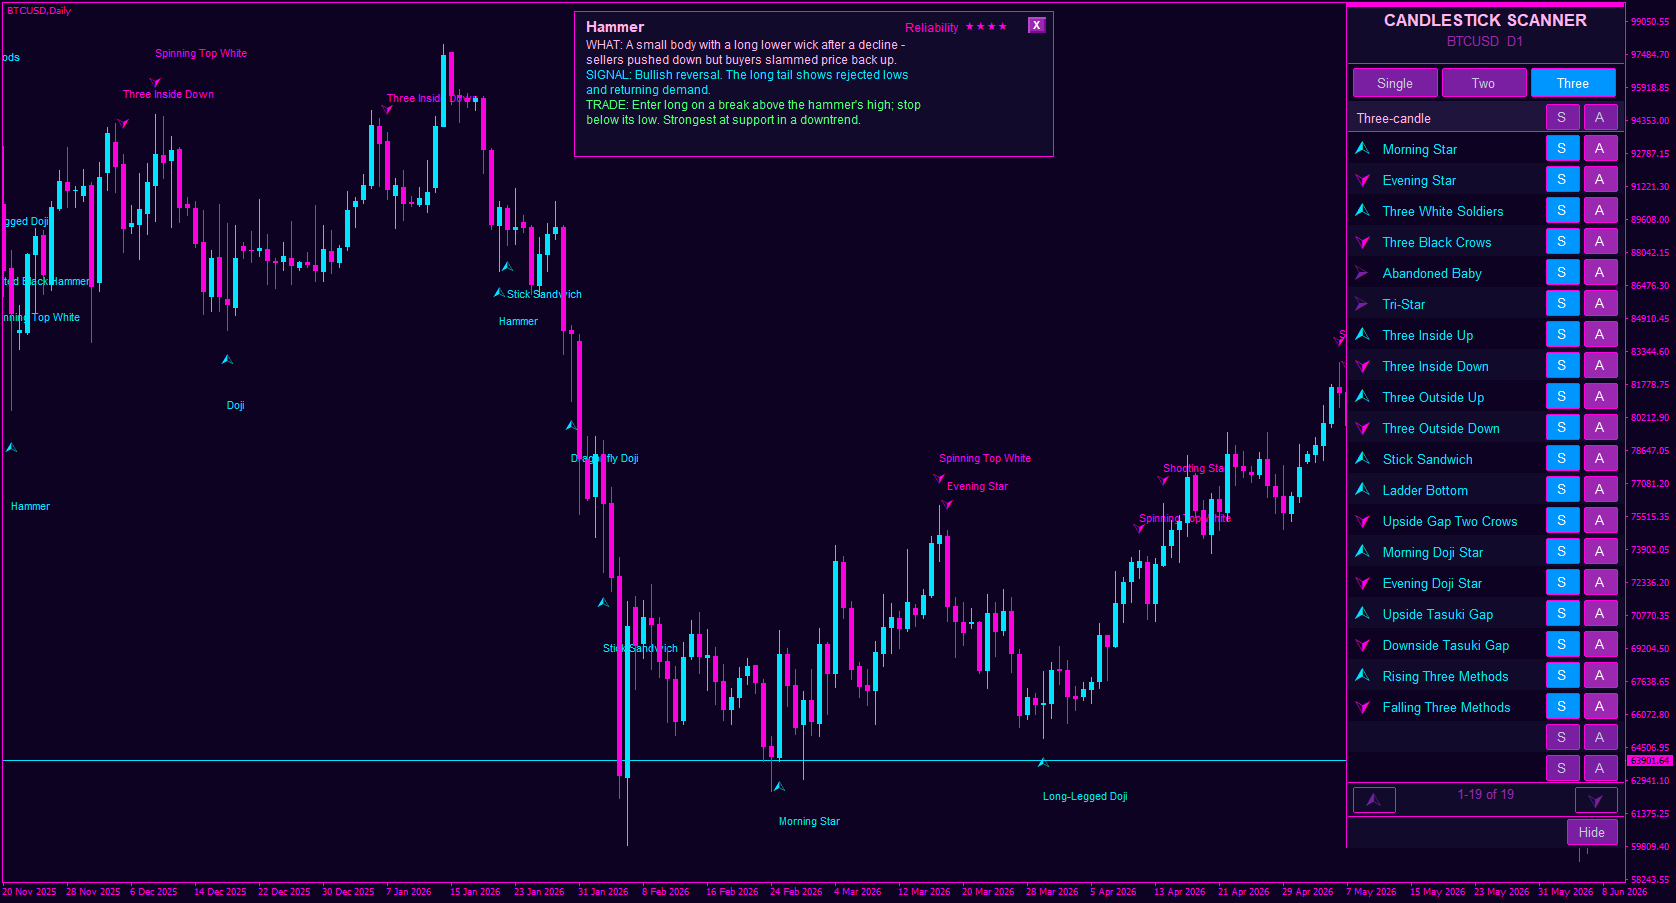
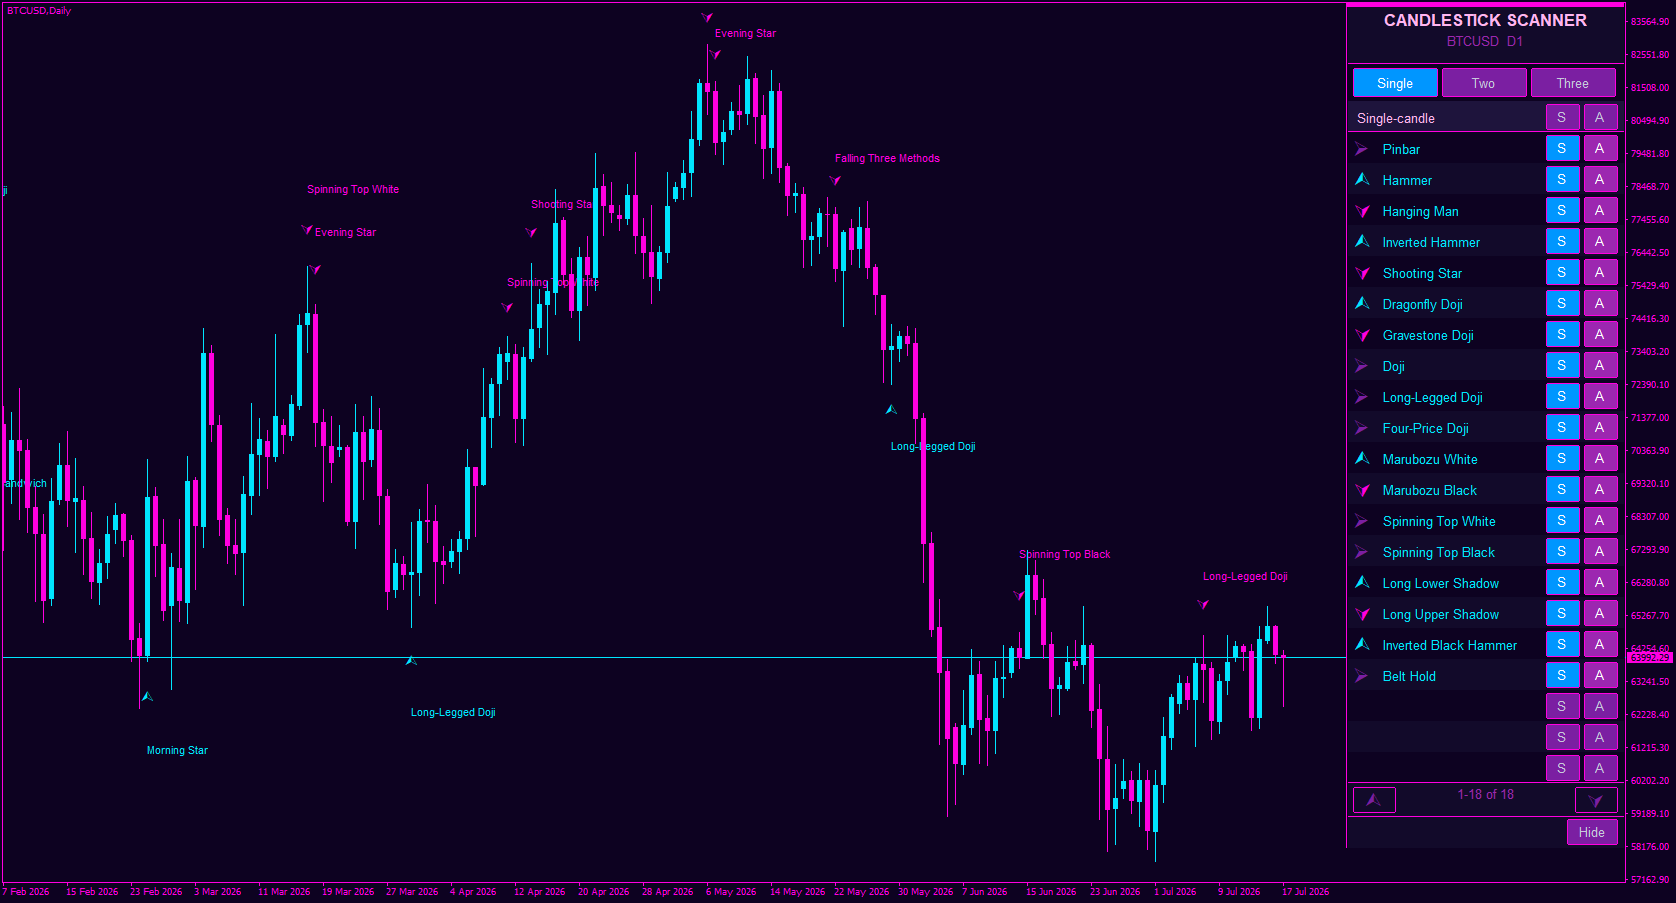
Candlestick Pattern Alert est un indicateur de figures de chandeliers japonais pour MT4 et MT5 conçu pour détecter, classer et afficher automatiquement plus de 50 figures majeures en temps réel. Optimisé pour le trading basé sur l'action des prix et l'analyse technique , cet indicateur analyse les chandeliers terminés, identifie les figures de retournement haussières et baissières confirmées ainsi
Two features I just added to the pattern detection dashboard:
⭐ Reliability meter - every pattern now shows a strength rating (★★★★☆) right on the card, so you know at a glance how much weight to give a signal. No more guessing which patterns actually matter.
📚 Learn mode - flip a switch and the dashboard cycles through every pattern one by one, like a mini tutorial built right into your charts. Learn the patterns while you trade.
I built these because I remember starting out and drowning in pattern names with no idea which ones to trust. This makes it click faster.
What patterns tripped you up when you were learning? Drop them below 👇 curious to hear.
Follow for the next update. 🔥
New candlestick pattern detection dashboard, spotting the patterns for you, right on the panel, so you're not squinting at charts trying to name what you're seeing.
This is the very first image I'm sharing. Still early, but it already looks this clean. 🔥
I've got a good feeling about this one.
What patterns would you want it to catch? Drop your must-haves below 👇 your input shapes what I build next.
Follow so you don't miss the next reveal. ⚡
Pivot Confluence Zones est un indicateur d'analyse technique pour MT4 et MT5 conçu pour identifier les zones de retracement , les zones de retournement et les niveaux de support et de résistance en combinant les points pivots , les retracements de Fibonacci , l'ATR et l'ADR dans un espace de trading unique. Au lieu de s'appuyer sur un seul outil technique, cet indicateur
The update so many of you have been waiting for just went out and this is a big one. Everything you've been asking for over the last few weeks made it into this release.
If you've been sitting on the fence, now's the time to take a proper look. And if you already own it, the update is waiting for you. 🙌
Huge thanks to everyone who sent feedback and ideas along the way v2.0 is genuinely shaped by this community.
Check it out, load it on your charts, and tell me what you think. 👇 Free demo available as always, results may vary, but I think you'll like what you see. 🔥
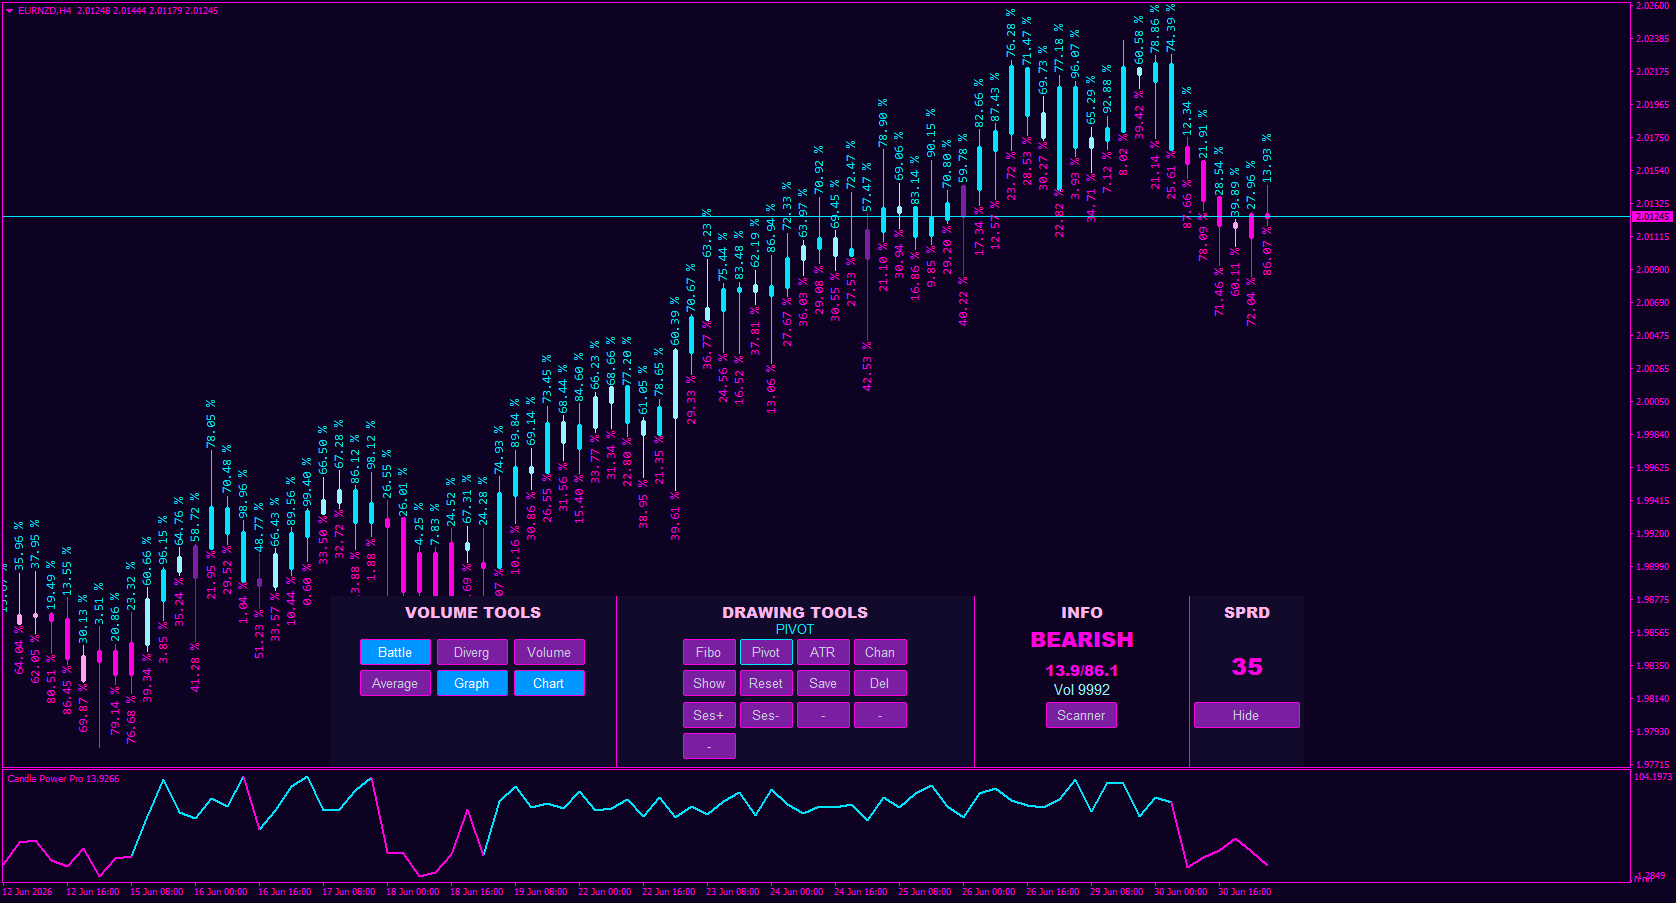
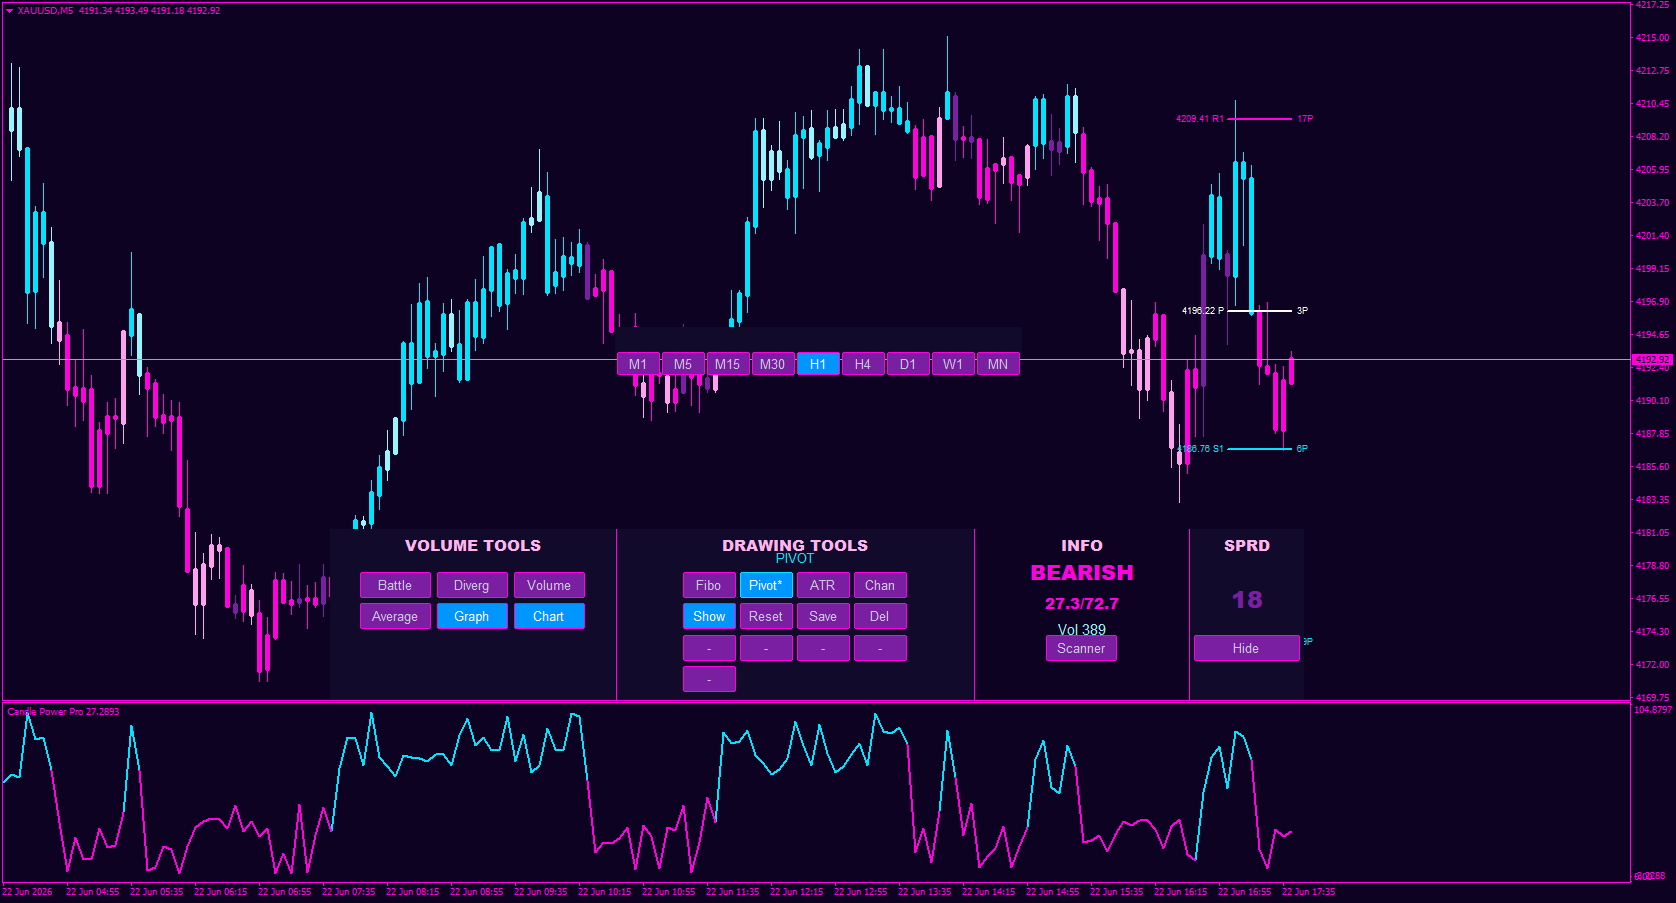
Candle Power Pro est un indicateur d'analyse de volume conçu pour analyser le volume réel des transactions , la pression haussière/baissière , les déséquilibres entre acheteurs et vendeurs , ainsi que les relations prix-volume directement sur le graphique. Cet indicateur transforme l'activité de volume des chandeliers en un système d'analyse visuelle du marché en affichant les pourcentages de volume haussier et
Candle Power Pro just got smarter. The updated Volume Spike algorithm now auto-detects high-volume candles and drops a 💣 bomb arrow right when a fresh trend kicks off. Look at the screenshot, every candle redraws by bull/bear percentage, and the moment a real volume spike hits, you see the signal clearly as a new trend opens (this one caught a sell). No guesswork, no squinting at volume bars.
This is the kind of edge I love building, simple to read, genuinely useful, and now fully automatic.
Want to see it live on your charts? Check out Candle Power Pro and grab the free demo. 👇 As always, results may vary, but the read is crystal clear.
Drop a comment if you'd run this strategy. 🔥
Take a close look at the dashboard and tell me what changed. First one to call it right gets bragging rights. 😏
Drop your guess below. 👇 I'll reveal it in the comments once a few of you have had a go.
Follow to catch the full update when it drops. 🔥
No name. No details. Just a look.
That cyber-synth glow, pivot levels mapped out, candle power signals sitting right behind your chart where you actually need them. All in one clean panel.
I'm obsessed with how this theme is coming together, but I want YOUR eyes on it.
What's the vibe? Does the design hit, or would you change something? Drop your honest take below. 👇
Something new is coming. Follow so you don't miss the reveal. ⚡
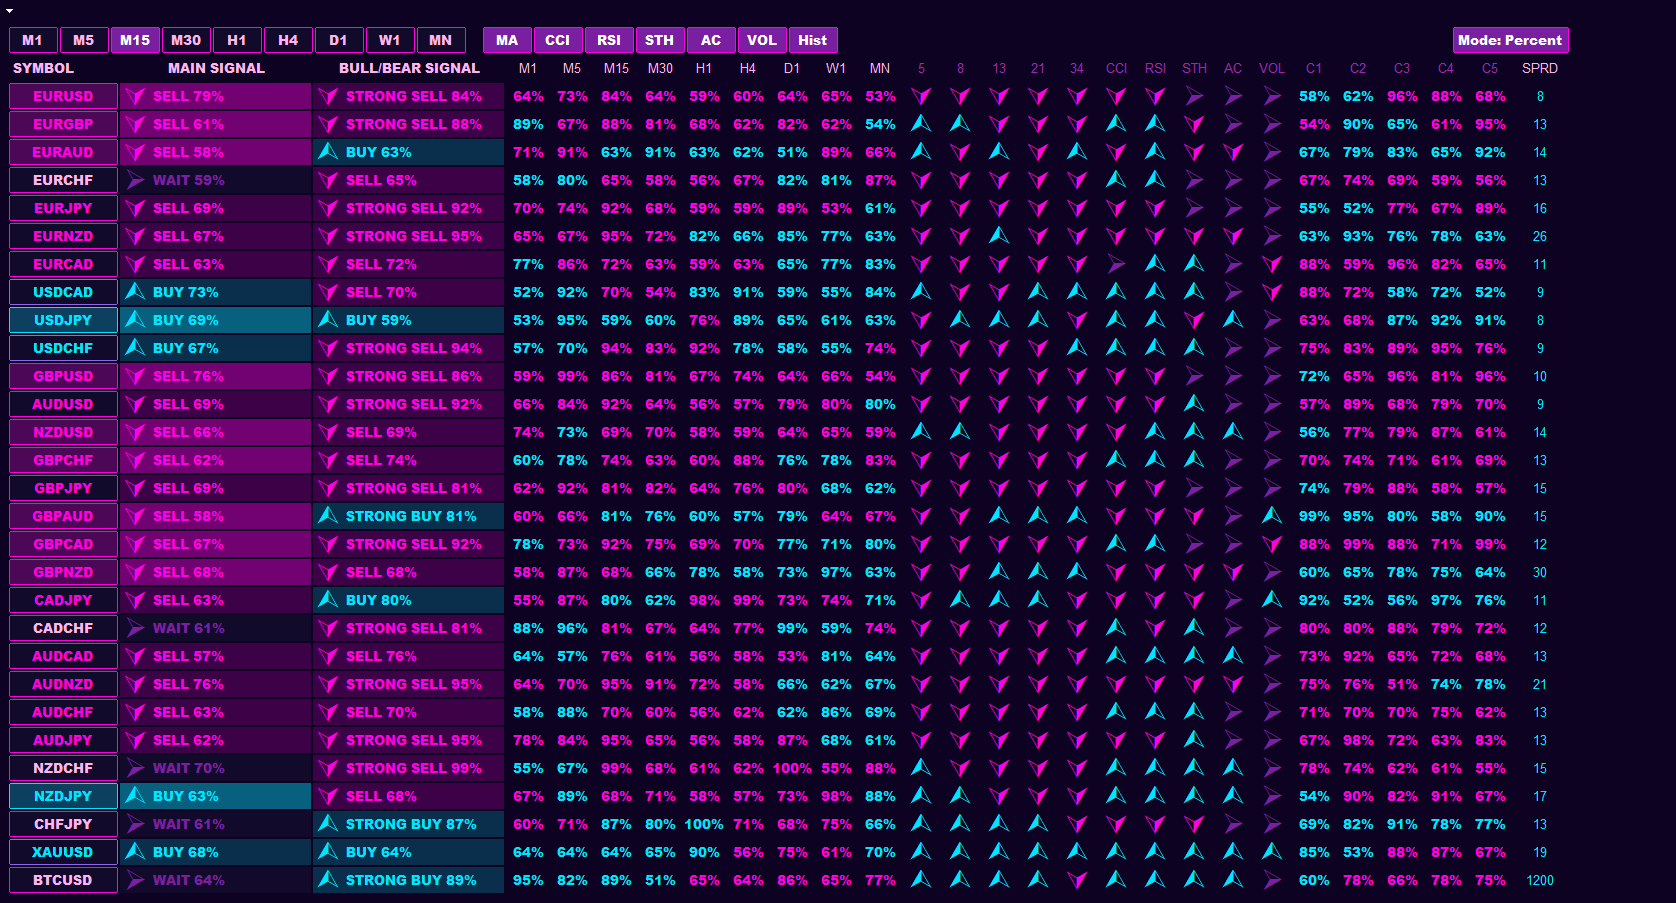
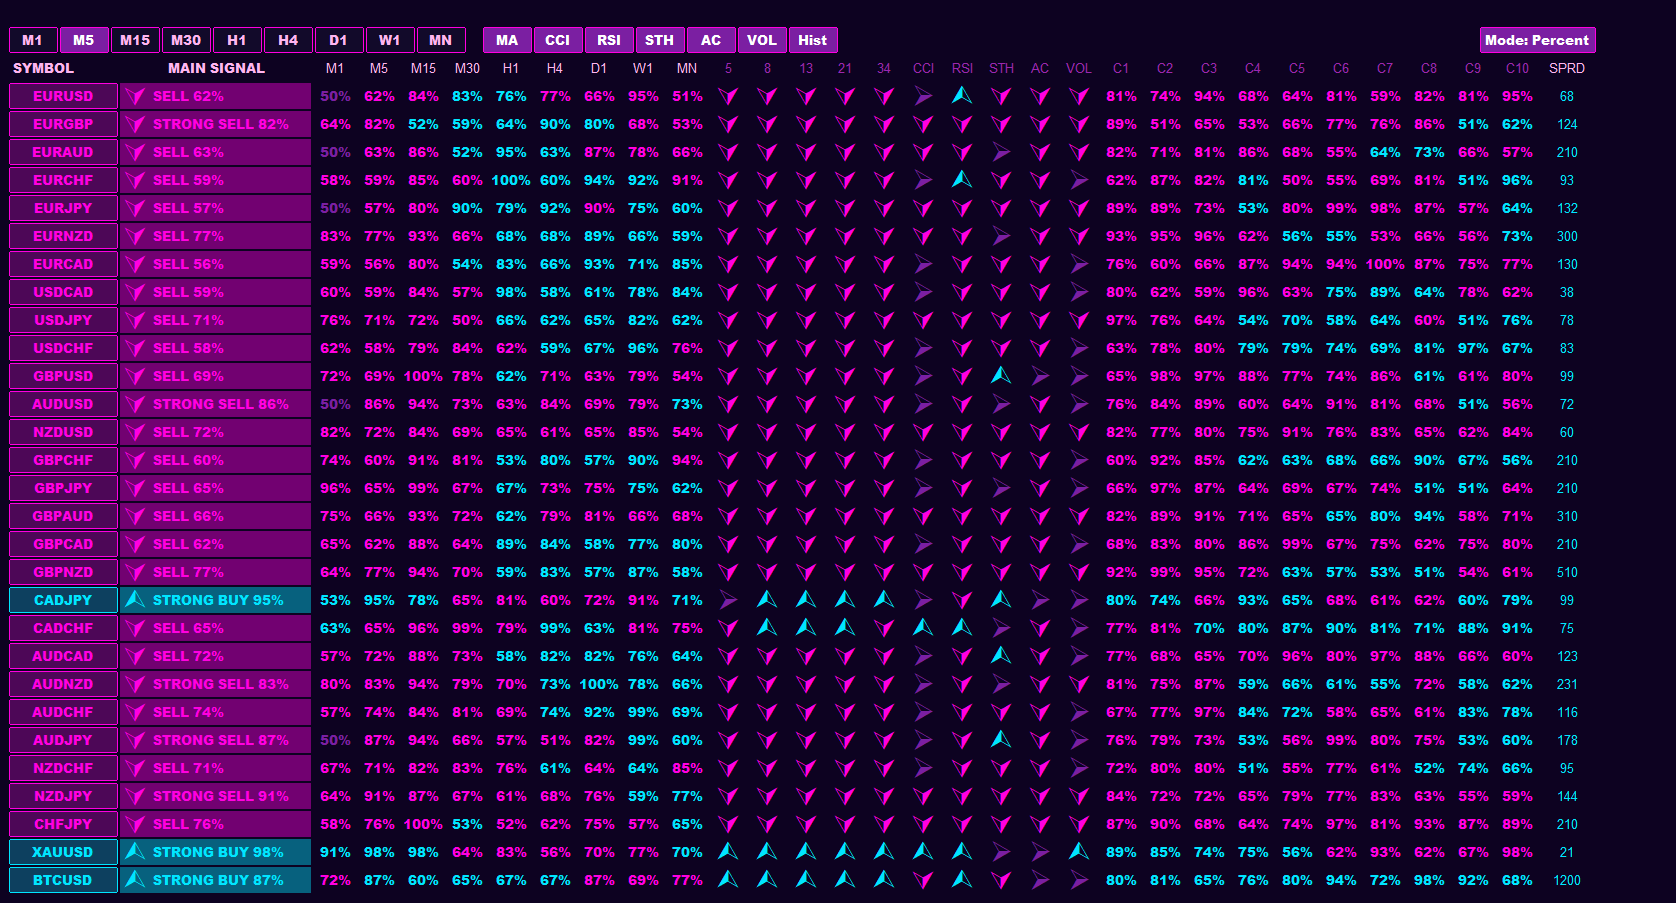
Candle Power Pro - Multisymbol Dashboard is finally taking shape.
One dashboard. All your symbols. All the candle strength data you need to read the market at a glance, no more jumping chart to chart trying to piece it together.
It's still under active development (not done yet, so be kind 😅), but it's at the point where I want to show it off and hear from you.
Here's my honest ask: take a look at this sneak peek and tell me what you think. What would make this a must-have on your charts? What's missing? Your feedback now actually shapes what ships.
Drop your honest review in the comments, good, bad, brutal. I read every one. 🙏
Follow to catch the release first.
Entry Point Dashboard Ultimate est un indicateur de trading multi-temporel pour MT4 et MT5 conçu pour simplifier l'analyse technique , l'analyse des tendances et l'identification des points d'entrée en combinant plusieurs outils de trading dans un tableau de bord visuel unique. Cet indicateur analyse les moyennes mobiles , le CCI , le RSI , le stochastique , les données de
L'indicateur Triple MA Crossover Alert est un indicateur de croisement de moyennes mobiles conçu pour analyser la direction du marché en combinant trois moyennes mobiles : rapide , normale et lente . Cet indicateur aide les traders à identifier les changements de tendance , les conditions haussières et baissières potentielles , ainsi que les zones importantes de mouvement des prix grâce