Thushara Dissanayake / Profil
- Information
|
9+ Jahre
Erfahrung
|
102
Produkte
|
102
Demoversionen
|
|
5
Jobs
|
0
Signale
|
0
Abonnenten
|
Mit über 8 Jahren Erfahrung als Programmierer und Forex-Händler habe ich mehr als 90 Produkte entwickelt und bisher über 1000 Mal verkauft. Meine Leidenschaft für Automatisierung treibt mich an, Tools zu entwickeln, die echtes Handelswissen abbilden und es Händlern erleichtern, intelligentere und schnellere Entscheidungen zu treffen.
Ich biete eine breite Palette an Handelslösungen für alle Arten von Händlern – vom Anfänger bis zum erfahrenen Profi, der präzise Tools sucht. Jedes meiner Produkte wird sorgfältig auf Qualität und Leistung geprüft, damit Sie Zugriff auf einige der zuverlässigsten und innovativsten Tools erhalten, die derzeit verfügbar sind.
Meine Mission ist einfach: Ich möchte Händlern helfen, sich weiterzuentwickeln, indem ich ihnen die richtigen Tools und kontinuierliche Unterstützung biete. Ich bin jederzeit für Ihre Fragen da und helfe Ihnen, das Beste aus Ihrer Handelsreise herauszuholen.
Schließen Sie sich unserer wachsenden Trader-Community an und entdecken Sie, welchen Unterschied gut entwickelte Forex-Trading-Roboter, Indikatoren und Trading-Apps für Ihren Erfolg ausmachen können.
Kanal: https://www.mql5.com/en/channels/forexrobotarmy
Chat: https://www.mql5.com/en/messages/010362012813dc01
GridFlux ist ein Grid-Trading-Expert Advisor (EA) , der für den automatisierten Grid-Handel, Range-Trading und das systematische Positionsmanagement entwickelt wurde. Der EA unterteilt den Markt in konfigurierbare Grid-Ebenen , legt einen strukturierten Rahmen für Kauf- und Verkaufspositionen fest und verwaltet die Positionen, während sich der Kurs zwischen den Grid-Ebenen bewegt. GridFlux vereint Grid-Abstand, Grid-Ebenen, automatisiertes Ordermanagement, Range-Market-Erkennung, ADX
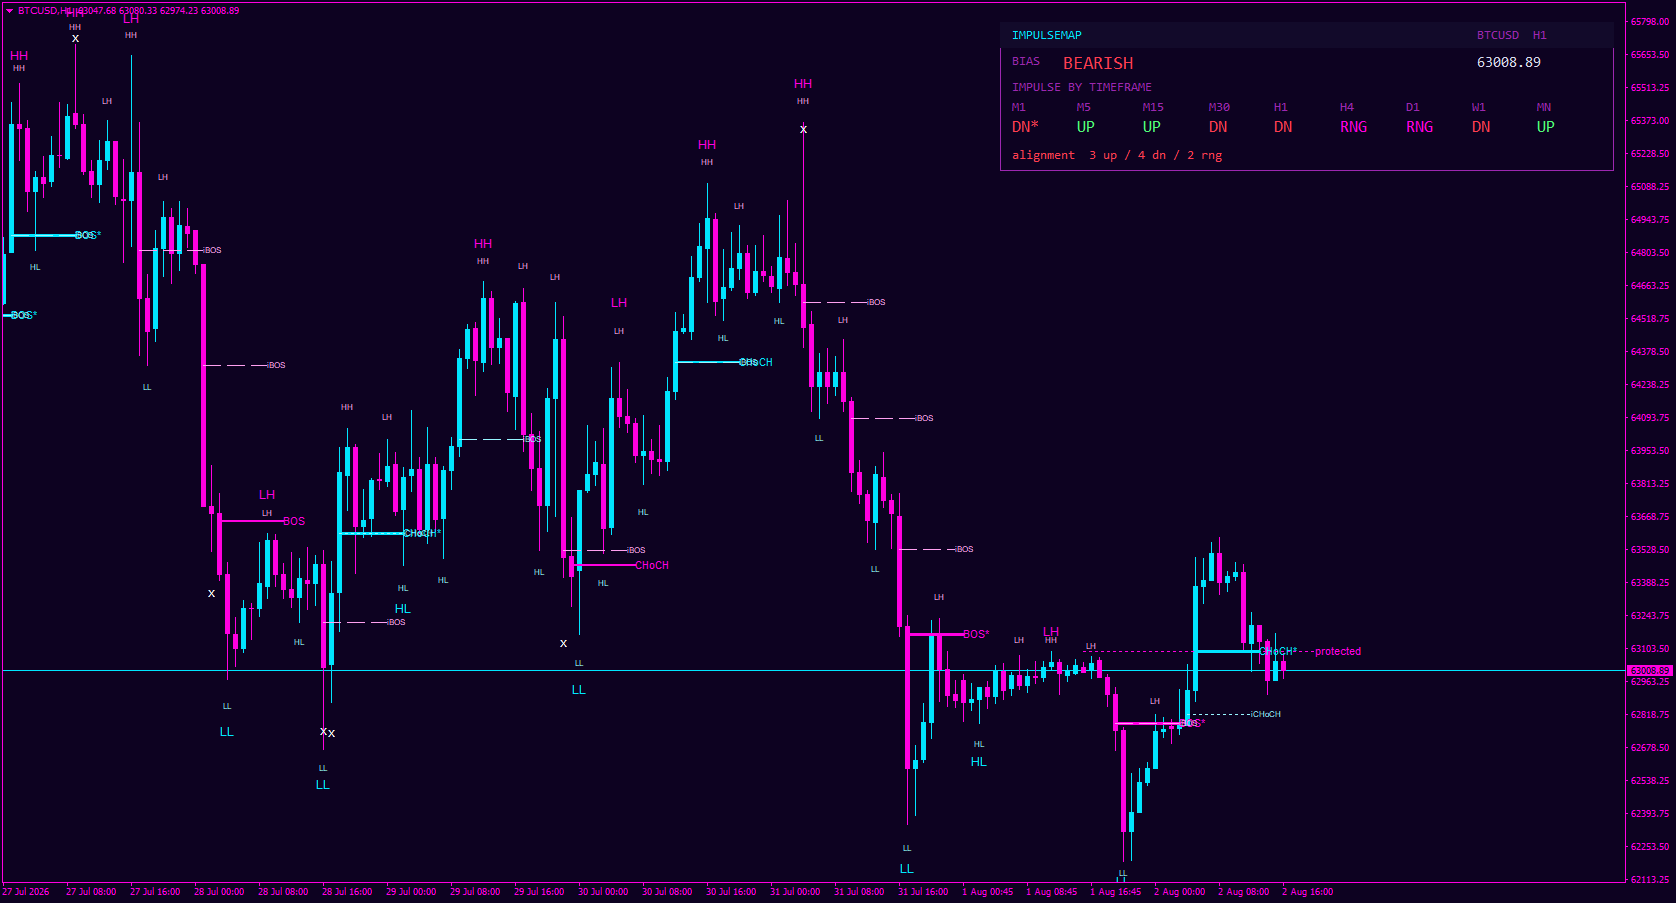
Impulskarte ist ein Marktstrukturindikator für MT4 und MT5 das automatisch identifiziert und kartiert Höhere Hochs (HH) , Höhere Tiefs (HL) , Niedrigere Hochs (LH) , Niedrigere Tiefststände (LL) , Strukturbrüche (BOS) , Charakterveränderungen (CHoCH) und
I'm putting the finishing touches on my new market structure indicator, and I'm pretty excited to get this one into your hands.
It automatically maps the key structure levels that most traders spend hours drawing manually. HH, HL, LH, LL, Breaks of Structure (BOS), CHoCH, and Liquidity Sweeps - all plotted in real-time on MT4 and MT5.
The main goal? To give you an objective visual of where price actually is in the cycle, without the guessing game.
What you'll see in the first version:
- Clear structure labeling so you can identify shifts in momentum at a glance.
- A Multi-Timeframe Panel to check alignment across higher TFs instantly.
- Built-in tooltips that explain each event on the chart (great for those still mastering SMC/ICT concepts).
It's built for price action purists who want clarity, not clutter. Whether you're trading Gold, Forex, or Crypto, the logic stays consistent.
I'll be sharing the first full screenshot and release soon. Let me know below if this is something you'd add to your toolkit. 👇
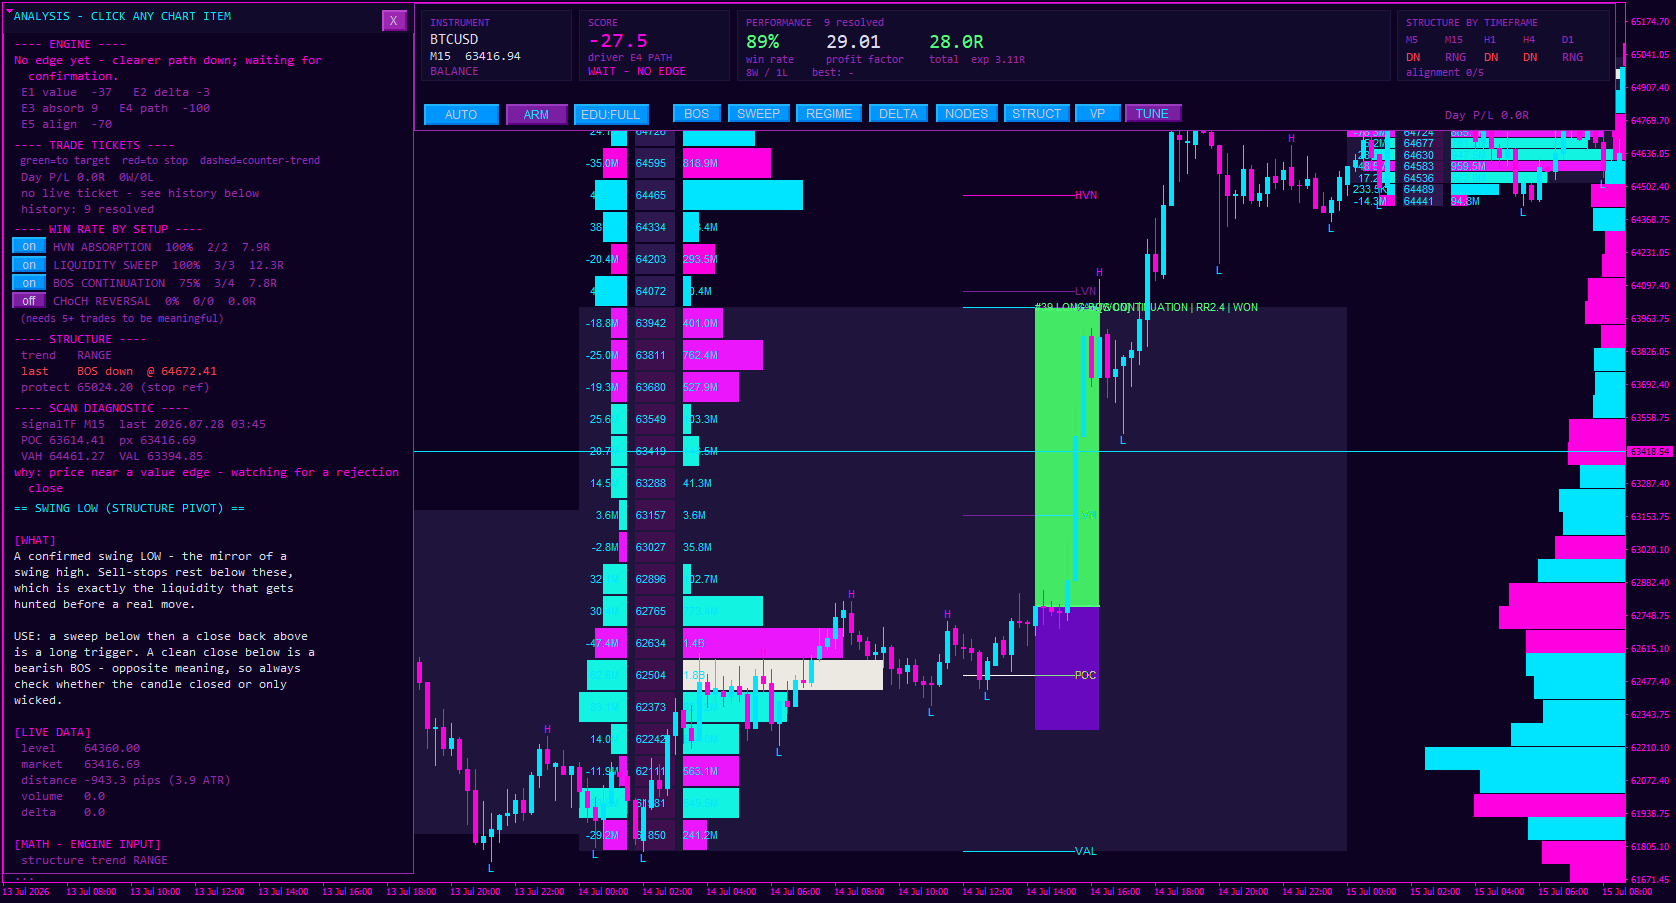
AuctionFlow-Struktur ist ein Volumenprofil und Marktstrukturindikator das kombiniert Volumenprofil , Delta-Analyse , Marktstruktur und Transparenz Entscheidungsmaschine Der Indikator soll Händlern helfen, potenzielle Handelsmöglichkeiten anhand objektiver Marktdaten zu bewerten. Anstatt sich auf ein einzelnes
AuctionFlow Structure coming soon.
If you trade auction theory, this one's for you. One intelligent workspace that brings together:
📊 Daily volume profiles
📍 Value areas
⚡ Delta
🏗️ Market structure
…all in one place. No more juggling five tools to read what the market's actually doing.
It also serves up scored trade tickets, so you can see the evidence behind each setup and weigh entries, exits, and risk with real market context, not gut feel.
This is the first screenshot I'm sharing, and I'm genuinely excited about this one. 🔥
Publishing soon. Follow so you're first in line when it drops, free demo will be available to try it yourself. ⚡
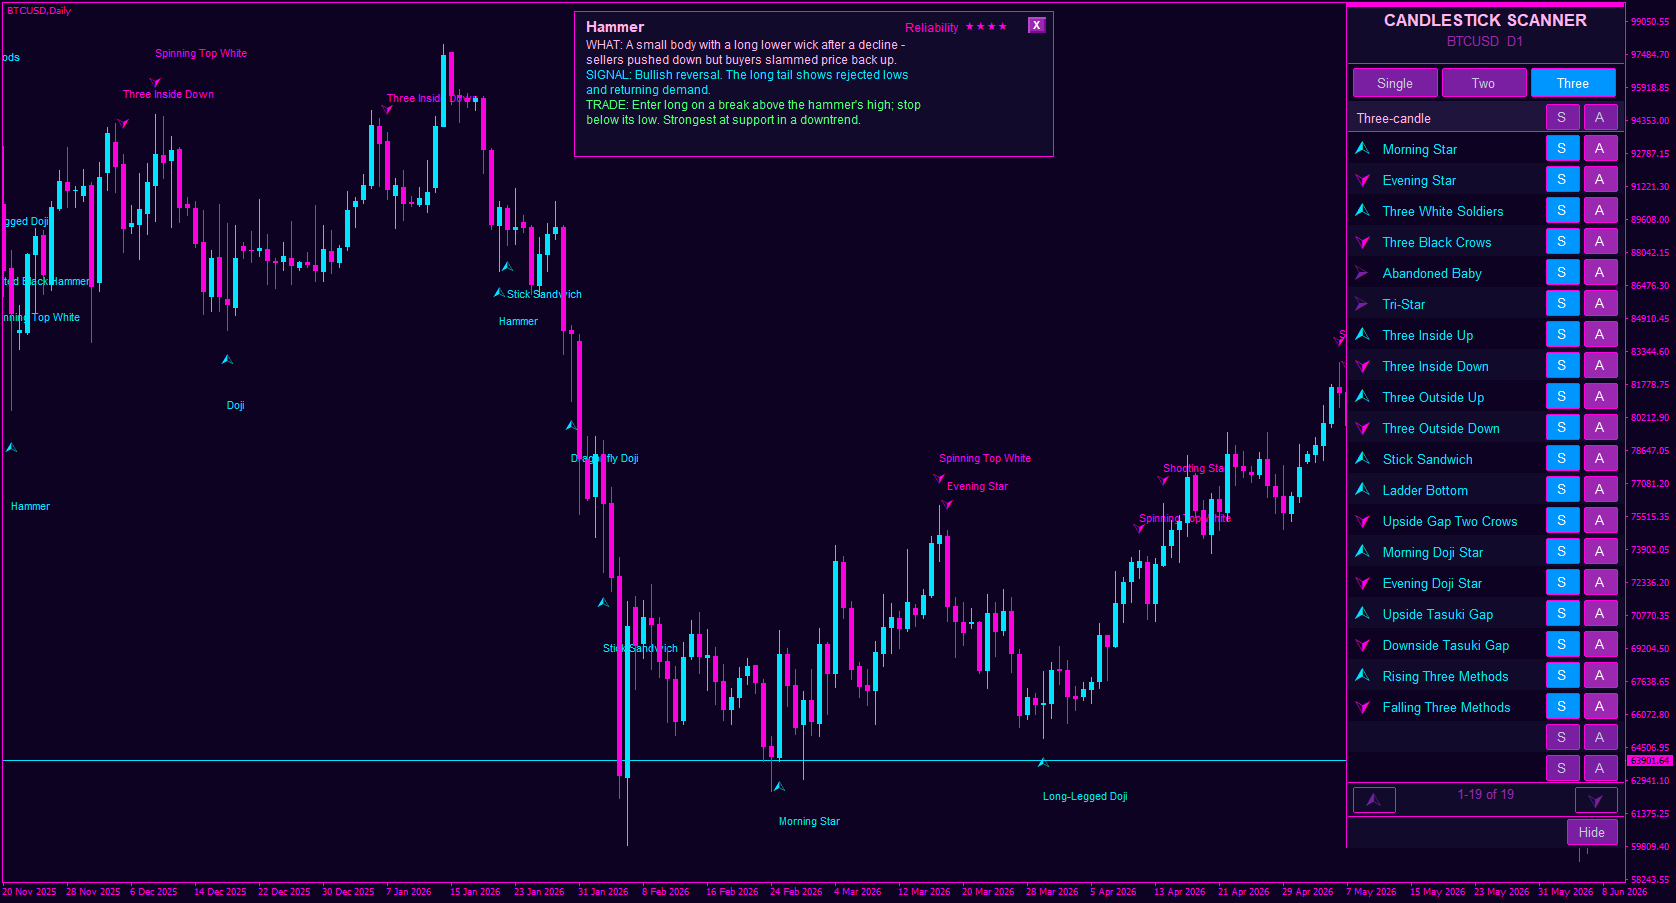
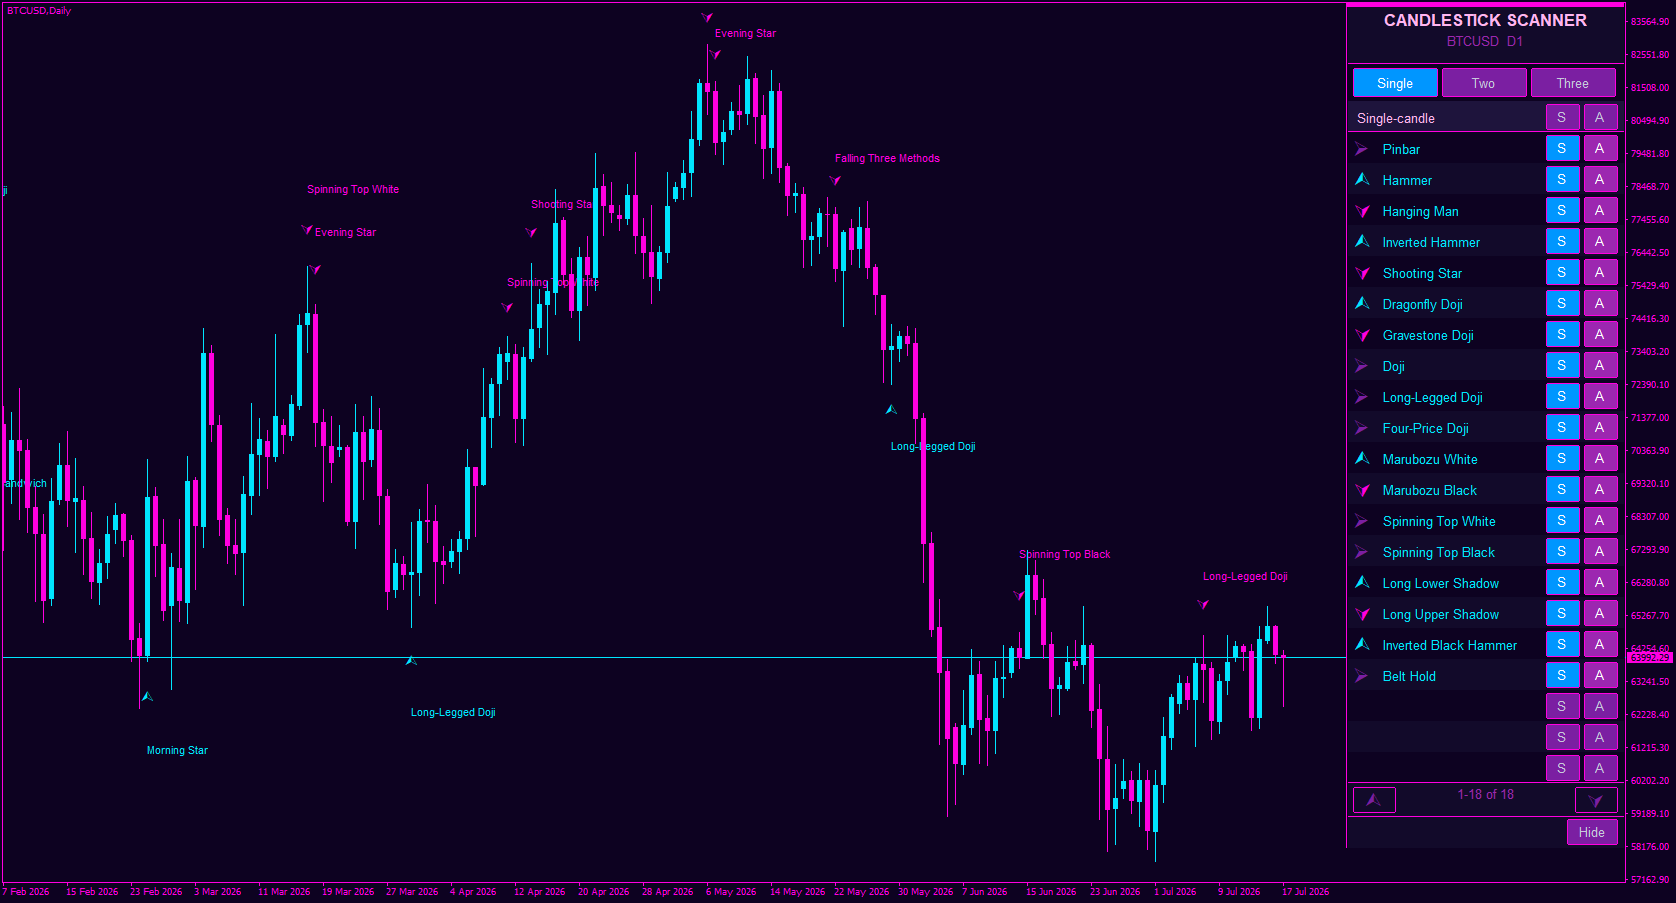
„Candlestick Pattern Alert“ ist ein Indikator für Kerzenmuster für MT4 und MT5 , der entwickelt wurde, um mehr als 50 wichtige japanische Kerzenmuster automatisch in Echtzeit zu erkennen, zu klassifizieren und anzuzeigen . Der Indikator wurde für den Price-Action-Handel und die technische Analyse entwickelt . Er scannt abgeschlossene Kerzen, identifiziert bestätigte bullische und bärische Umkehrmuster sowie Fortsetzungsmuster und markiert diese direkt im Chart mit deutlichen Pfeilen und
Candlestick Pattern Alert ist ein Candlestick-Musterindikator für MT4 und MT5, der automatisch über 50 wichtige japanische Candlestick-Muster in Echtzeit erkennt, klassifiziert und anzeigt. Der Indikator wurde für Price-Action-Trading und technische Analyse entwickelt und scannt abgeschlossene Candlesticks, identifiziert bestätigte bullische und bärische Umkehr- und Fortsetzungsmuster und markiert
Two features I just added to the pattern detection dashboard:
⭐ Reliability meter - every pattern now shows a strength rating (★★★★☆) right on the card, so you know at a glance how much weight to give a signal. No more guessing which patterns actually matter.
📚 Learn mode - flip a switch and the dashboard cycles through every pattern one by one, like a mini tutorial built right into your charts. Learn the patterns while you trade.
I built these because I remember starting out and drowning in pattern names with no idea which ones to trust. This makes it click faster.
What patterns tripped you up when you were learning? Drop them below 👇 curious to hear.
Follow for the next update. 🔥
New candlestick pattern detection dashboard, spotting the patterns for you, right on the panel, so you're not squinting at charts trying to name what you're seeing.
This is the very first image I'm sharing. Still early, but it already looks this clean. 🔥
I've got a good feeling about this one.
What patterns would you want it to catch? Drop your must-haves below 👇 your input shapes what I build next.
Follow so you don't miss the next reveal. ⚡
Pivot Confluence Zones ist ein technischer Analyseindikator für MT4 und MT5, der Retracement-Zonen , Umkehrbereiche sowie Unterstützungs- und Widerstandsniveaus identifiziert. Er kombiniert Pivot-Punkte , Fibonacci-Retracements , ATR und ADR in einem einzigen Trading-Bereich. Anstatt sich auf ein einzelnes technisches Werkzeug zu verlassen, sucht der Indikator nach
The update so many of you have been waiting for just went out and this is a big one. Everything you've been asking for over the last few weeks made it into this release.
If you've been sitting on the fence, now's the time to take a proper look. And if you already own it, the update is waiting for you. 🙌
Huge thanks to everyone who sent feedback and ideas along the way v2.0 is genuinely shaped by this community.
Check it out, load it on your charts, and tell me what you think. 👇 Free demo available as always, results may vary, but I think you'll like what you see. 🔥
Candle Power Pro ist ein Volumenanalyse-Indikator , der das tatsächliche Tick-Volumen , den Bullen-/Bärendruck , das Ungleichgewicht zwischen Käufern und Verkäufern sowie die Preis-Volumen-Beziehungen direkt im Chart analysiert . Der Indikator wandelt die Candle-Volumenaktivität in ein visuelles Marktanalysesystem um, indem er die prozentualen Anteile des Bullen- und Bärenvolumens , die
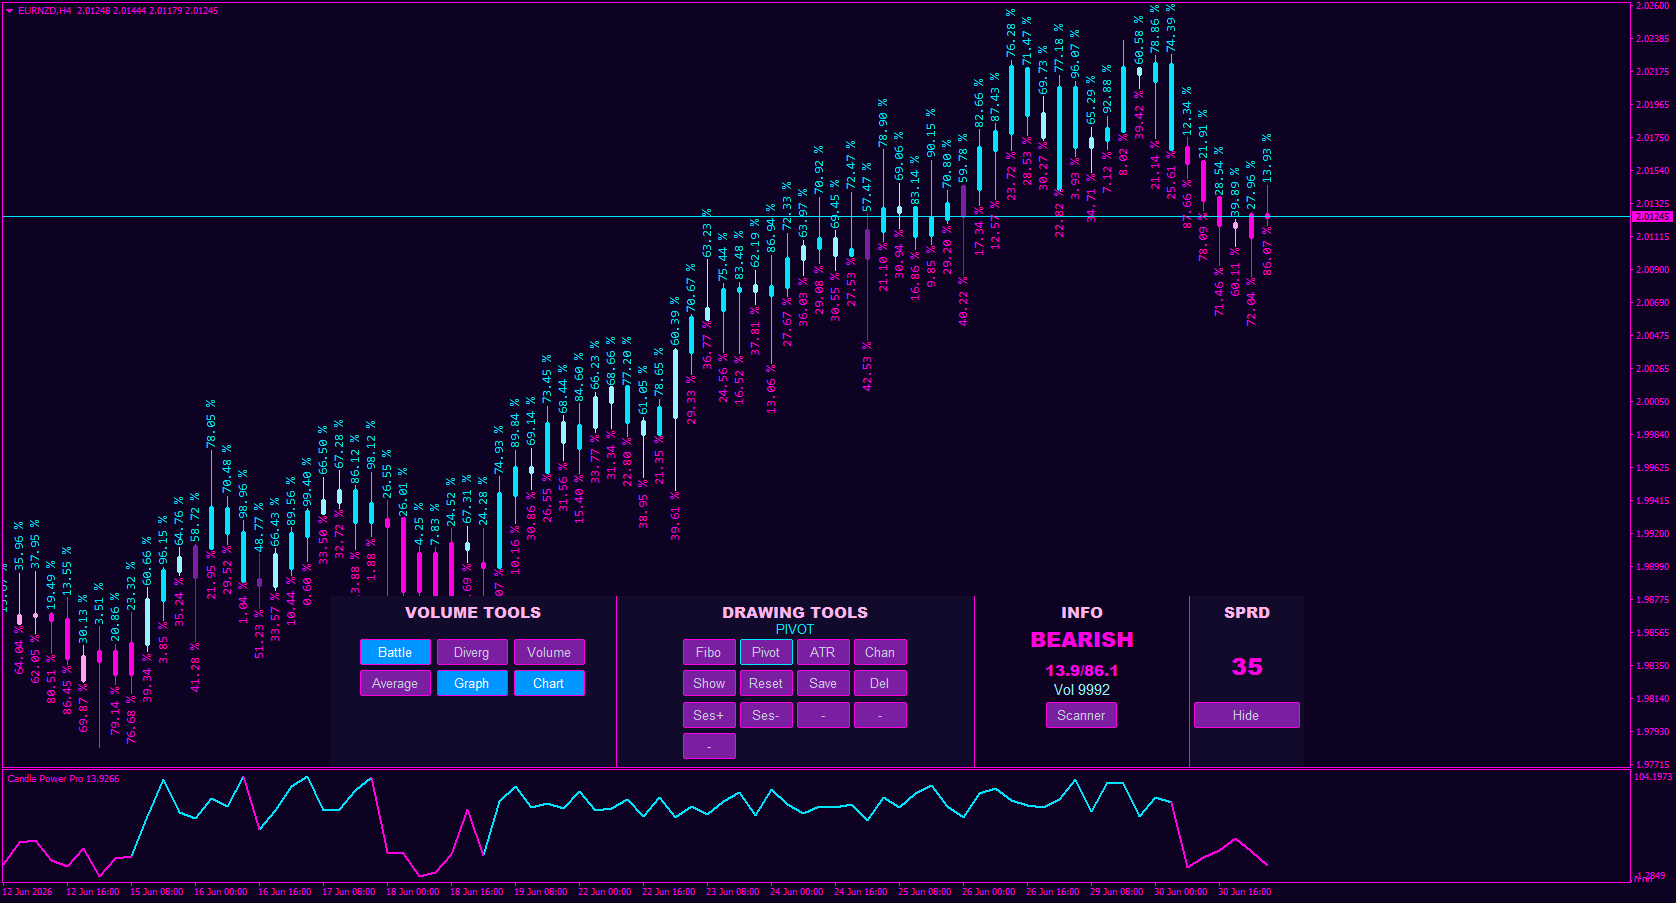
Candle Power Pro just got smarter. The updated Volume Spike algorithm now auto-detects high-volume candles and drops a 💣 bomb arrow right when a fresh trend kicks off. Look at the screenshot, every candle redraws by bull/bear percentage, and the moment a real volume spike hits, you see the signal clearly as a new trend opens (this one caught a sell). No guesswork, no squinting at volume bars.
This is the kind of edge I love building, simple to read, genuinely useful, and now fully automatic.
Want to see it live on your charts? Check out Candle Power Pro and grab the free demo. 👇 As always, results may vary, but the read is crystal clear.
Drop a comment if you'd run this strategy. 🔥
Take a close look at the dashboard and tell me what changed. First one to call it right gets bragging rights. 😏
Drop your guess below. 👇 I'll reveal it in the comments once a few of you have had a go.
Follow to catch the full update when it drops. 🔥
No name. No details. Just a look.
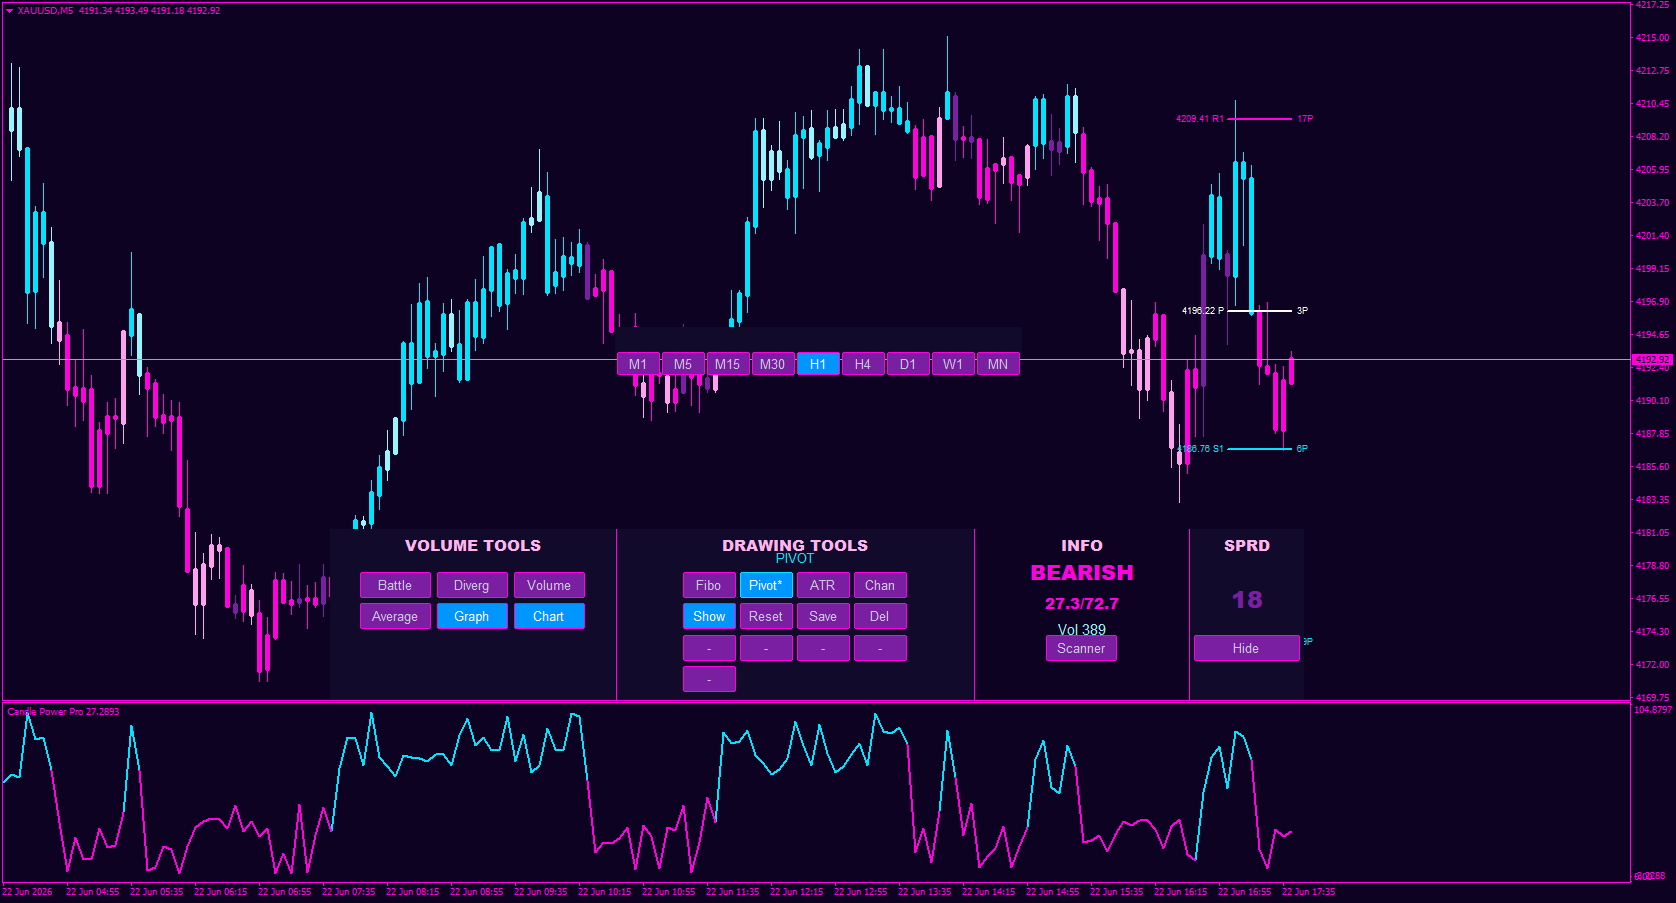
That cyber-synth glow, pivot levels mapped out, candle power signals sitting right behind your chart where you actually need them. All in one clean panel.
I'm obsessed with how this theme is coming together, but I want YOUR eyes on it.
What's the vibe? Does the design hit, or would you change something? Drop your honest take below. 👇
Something new is coming. Follow so you don't miss the reveal. ⚡
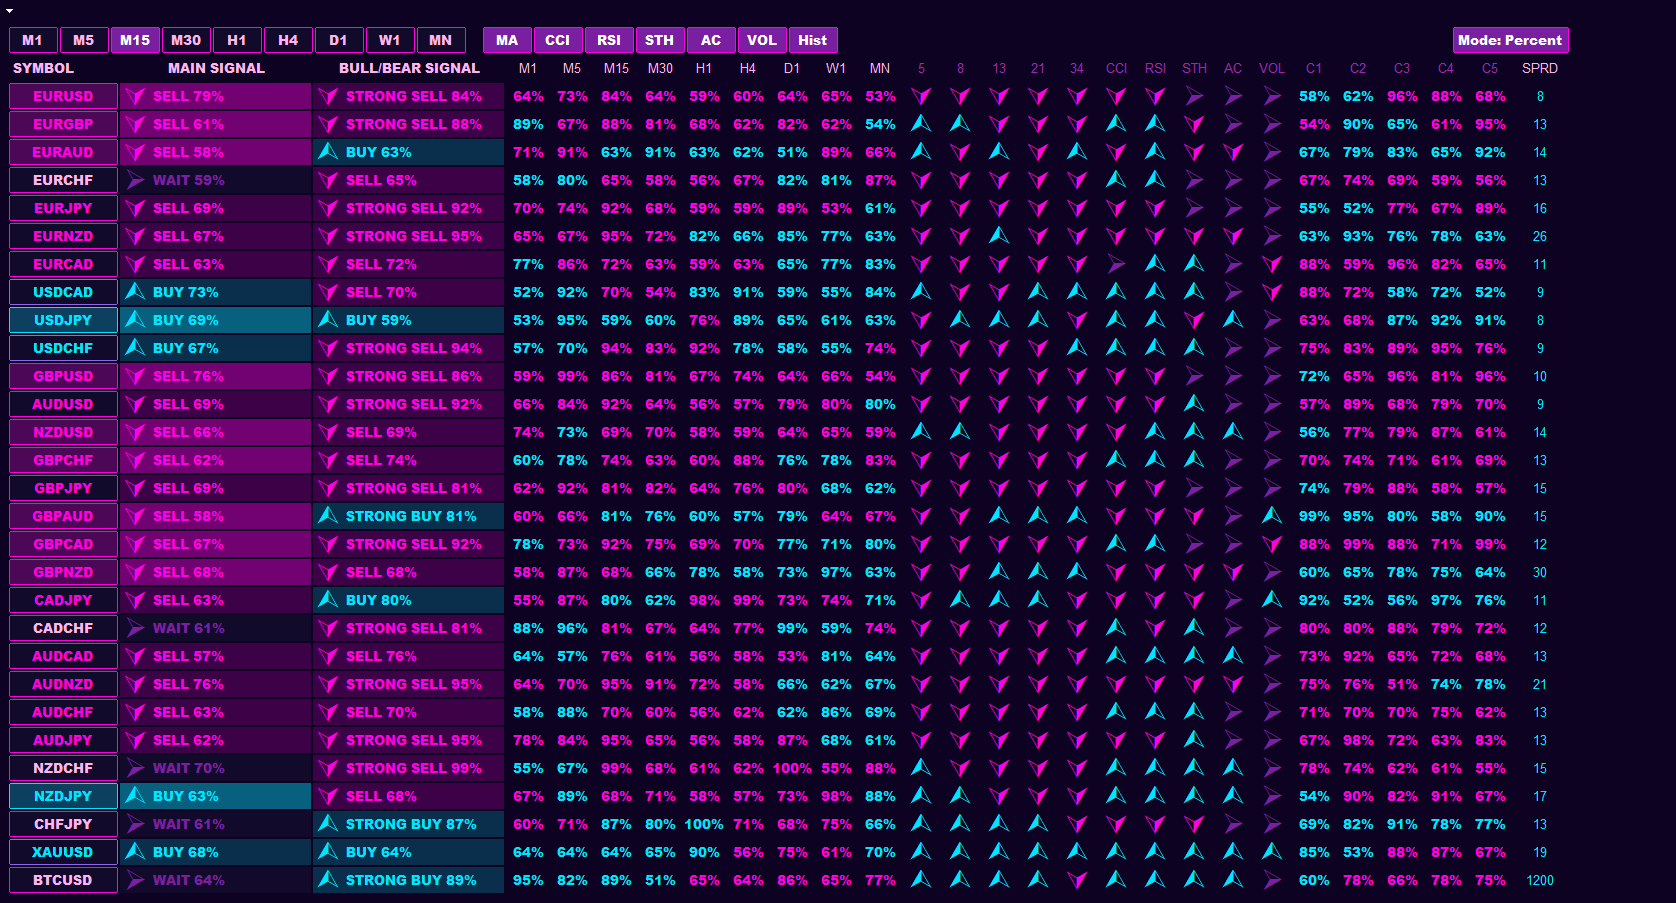
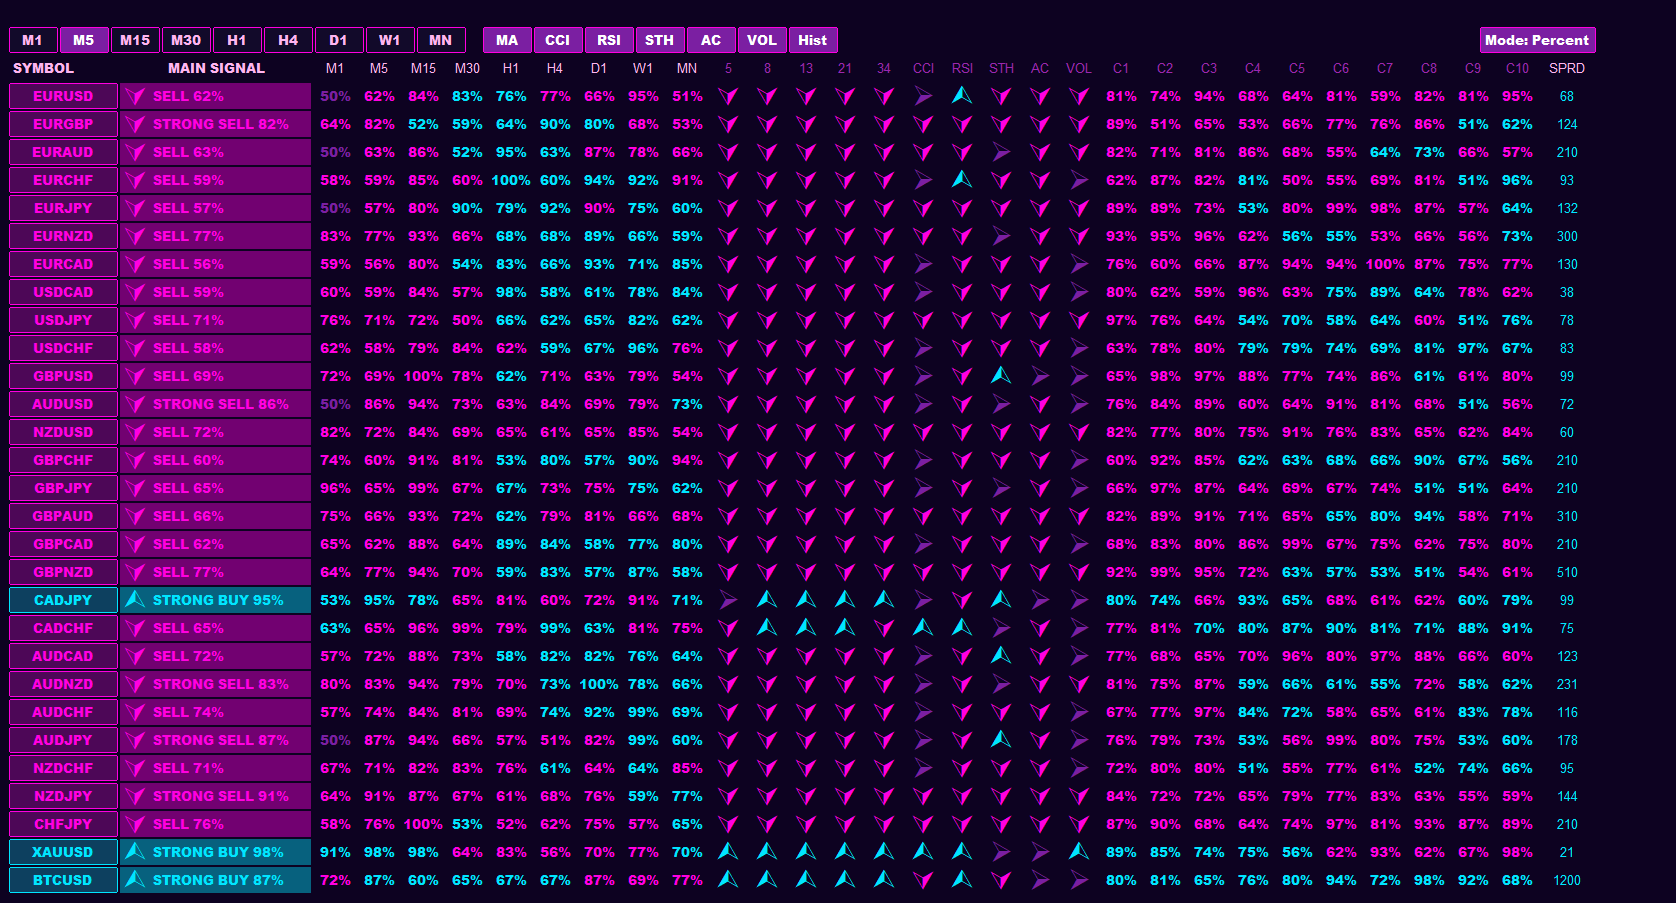
Candle Power Pro - Multisymbol Dashboard is finally taking shape.
One dashboard. All your symbols. All the candle strength data you need to read the market at a glance, no more jumping chart to chart trying to piece it together.
It's still under active development (not done yet, so be kind 😅), but it's at the point where I want to show it off and hear from you.
Here's my honest ask: take a look at this sneak peek and tell me what you think. What would make this a must-have on your charts? What's missing? Your feedback now actually shapes what ships.
Drop your honest review in the comments, good, bad, brutal. I read every one. 🙏
Follow to catch the release first.
Entry Point Dashboard Ultimate ist ein Multi-Timeframe-Trading-Dashboard-Indikator für MT4 und MT5, der die technische Analyse , die Markttrendanalyse und die Identifizierung von Einstiegspunkten vereinfacht, indem er mehrere Trading-Tools in einem einzigen visuellen Dashboard vereint. Der Indikator analysiert gleitende Durchschnitte , CCI , RSI , Stochastik , Momentum-Daten und
Der Triple MA Crossover Alert ist ein Indikator für gleitende Durchschnitte , der die Marktrichtung anhand einer Kombination aus drei gleitenden Durchschnitten analysiert: dem schnellen , dem normalen und dem langsamen gleitenden Durchschnitt . Der Indikator hilft Händlern, Trendwechsel , potenzielle Aufwärts- und Abwärtsphasen sowie wichtige Kursbewegungsbereiche durch eine klare Struktur aus drei