ALFRED MURIITHI
- Product Testing en Innovicient Limited
- Kenia
- 10449
|
11+ años
experiencia
|
26
productos
|
216
versiones demo
|
|
0
trabajos
|
0
señales
|
0
suscriptores
|
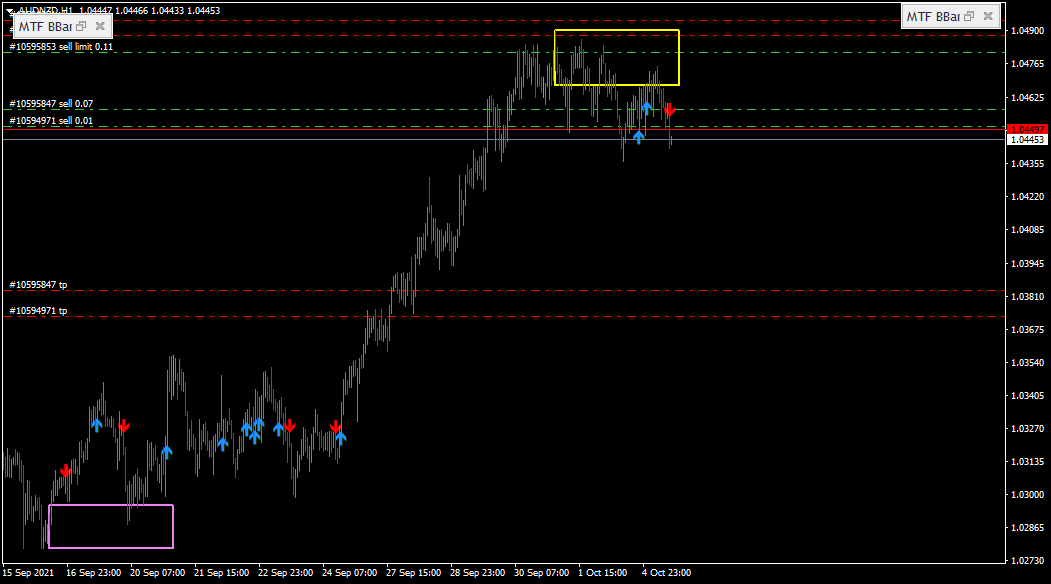
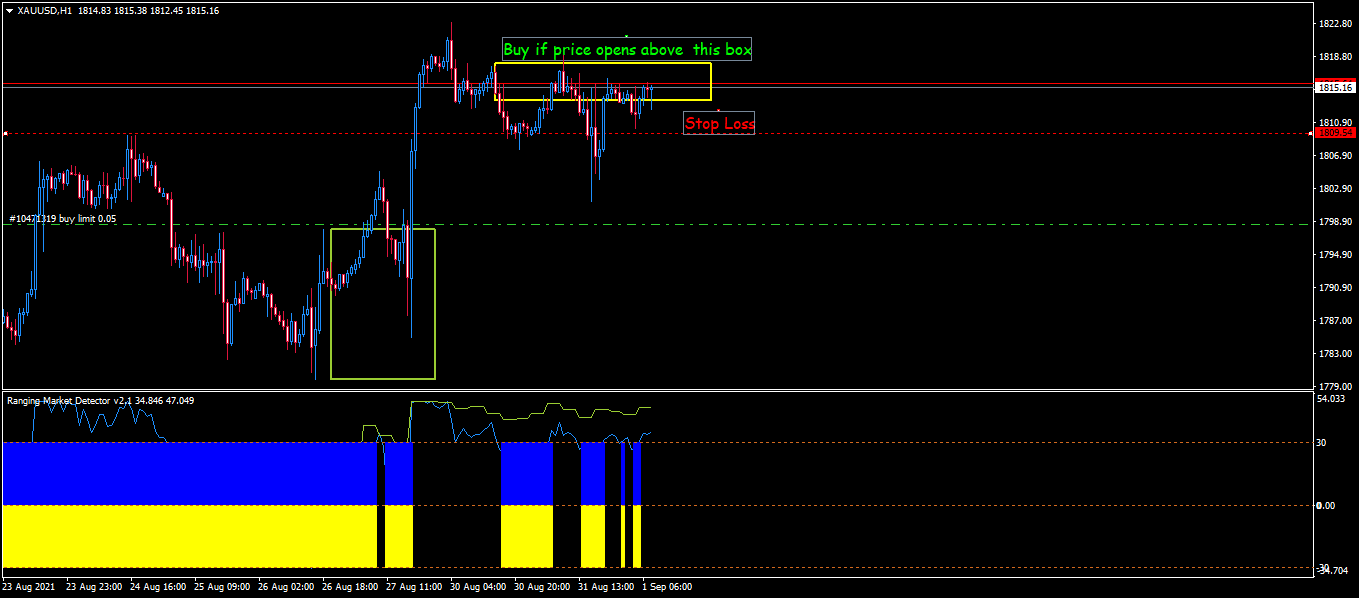
Soy un diseñador de estrategia y un comerciante. Con algunas excelentes herramientas de trabajo que nuestro equipo ha desarrollado, nuestros clientes pueden operar cualquier instrumento con un buen nivel de previsibilidad.