Mochamad Briend Mega Bayu Angkasa
  • Información
2 años
experiencia
0
productos
0
versiones demo
0
trabajos
0
señales
0
suscriptores
Amigos 1
Mochamad Briend Mega Bayu Angkasa
#EURUSD 📊 Clear bullish bias as long as price holds above trendline support, buyers control the market. A breakout could fuel the next leg higher.
Mochamad Briend Mega Bayu Angkasa
#xauusd

Gold on the 4H chart is completing a corrective phase after holding above key support and the structure shows wave two has ended with momentum shifting in favor of buyers as wave three extends higher while price action forms higher lows and impulsive candles confirm strength the short term retracement into the demand zone should attract liquidity before continuation and fundamentals remain supportive as safe haven demand is backed by global uncertainty and weaker dollar outlook which aligns with the technical projection of further upside in the current bullish wave cycle.
Mochamad Briend Mega Bayu Angkasa
👉The support trendline has been broken, and the price is retesting from below. As long as the price stays under the resistance, we could see potential bearish momentum. Watch for potential downside opportunities.

🔥Don’t miss this move
🤝Stay prepared,the market rewards those who wait for the right moment.
Mochamad Briend Mega Bayu Angkasa
#GBPUSD 🇬🇧🇺🇸

Normally, a Wave 2 correction often extends to the Fib 61.8% level.
But sometimes, it ends earlier than expected.

👉 On chart, for he 2nd wave in blue, while there’s still a chance the correction isn’t finished, the price action shows that price may already starts of the next move upward.

⚠️ However, if price touches the invalidation level, we could see a deeper pullback toward 1.3315 before the trend resumes.

This is why trading Elliott Wave is about being prepared and managing risk correctly. ✅
Mochamad Briend Mega Bayu Angkasa
#USDJPY 🇺🇸🇯🇵

For weeks the market has been moving in a slow and corrective phase… but this is about to change.

👉 We are now entering the impulse phase; the stage where momentum builds and opportunities become clearer.

USDJPY is showing the first signs of this shift. The calm is ending, and the next big move is on the horizon.

⚡ In trading, patience during corrections is what allows you to profit when the impulse finally arrives. Stay focused and be ready to act.

🚀 The exciting part is just beginning.
Mochamad Briend Mega Bayu Angkasa
CADJPY on the 6 hour timeframe has confirmed a break below the ascending channel following a double top formation at the recent swing high with bearish momentum accelerating after rejecting the retest of the broken trendline the downside move is supported by weakening crude oil prices putting pressure on the Canadian dollar while safe haven demand is strengthening the yen this confluence of technical breakdown and fundamental bias suggests continuation toward the next major support zone with sellers maintaining control
Mochamad Briend Mega Bayu Angkasa
USDJPY on the four hour chart has completed a clear head and shoulders structure signaling a potential bearish reversal as price broke below the rising trendline with momentum while failing to reclaim the neckline level overall market sentiment is pressured by a softer dollar outlook amid cautious risk tone and expectations of stable monetary policy from the Bank of Japan combined with weaker US economic projections this technical breakdown aligns with the broader shift toward safe haven flows suggesting further downside continuation in the near term.
Mochamad Briend Mega Bayu Angkasa
USDJPY on the four hour chart has completed a clear head and shoulders structure signaling a potential bearish reversal as price broke below the rising trendline with momentum while failing to reclaim the neckline level overall market sentiment is pressured by a softer dollar outlook amid cautious risk tone and expectations of stable monetary policy from the Bank of Japan combined with weaker US economic projections this technical breakdown aligns with the broader shift toward safe haven flows suggesting further downside continuation in the near term.
Mochamad Briend Mega Bayu Angkasa
#gbpusd

Probably The Best Support Price may Face
Mochamad Briend Mega Bayu Angkasa
#AUDUSD 🇦🇺🇺🇸

📈 The market follows one rule again and again:
Impulse → Correction → Impulse → Correction…

No matter the asset, no matter the time frame, this structure repeats itself.

The trick is not to chase every move.
The real skill is to recognize the correction as preparation for the next big impulse.

If you’re patient, if you have a clear trading plan,
You’ll always find yourself on the right side of the wave. 🌊
Mochamad Briend Mega Bayu Angkasa
EURNZD on the 8H chart is showing clear exhaustion after forming a double top near the psychological resistance at price structure confirms a completed rising wedge indicating bearish divergence and potential trend reversal from a wave five high price failed to sustain above the resistance zone highlighting strong selling pressure from institutional levels on the fundamental side the New Zealand economy shows resilience supported by recent hawkish RBNZ stance while Eurozone faces stagnation due to weak industrial output and geopolitical uncertainty this imbalance increases downside probability with next key Support 1.92000.
Mochamad Briend Mega Bayu Angkasa
#gbpusd

GBPUSD on the daily timeframe has broken a long-term ascending trendline and confirmed a classic head and shoulders pattern indicating a major shift in market structure from bullish to bearish the price has completed the neckline break and is now in a retest phase around the 1.34000 resistance zone previously a strong support this level aligns with both the neckline and broken trendline suggesting a high-probability area for bearish continuation rejection from this zone could trigger a fresh impulsive move to the downside with potential targets toward the Support region and lower if bearish momentum sustains.
Mochamad Briend Mega Bayu Angkasa
#GBPUSD


We still expect more downside in #GBPUSD.


Typically, wave B tends to correct wave A up to the Fib 50-61.8 zone.

However, in this case, we’re watching the Fib 38.2 level closely!

Why?

✔️ Strong support/resistance zone

✔️ Matches the neckline of the H&S pattern


If the price breaks above this resistance and holds, we’ll replan for a scenario where wave 2 might have ended earlier than expected.


📌 In trading, it’s not about what we expect;

It’s about how the market actually moves.

Follow the structure. Trade the plan. 🎯


🚀 Want to follow the next steps with us?

You can unlock all charts and daily updates by joining the Premium membership.
Mochamad Briend Mega Bayu Angkasa
The Dollar Index on the daily timeframe has completed a five wave impulsive structure followed by an ABC corrective phase forming a falling wedge pattern which has now broken to the upside suggesting a potential bullish reversal with wave one of a new impulsive sequence already in play currently pulling back near the Fibonacci 0.382 retracement level of the initial wave this aligns with strong macroeconomic tailwinds as recent hawkish comments from Fed officials reinforce the possibility of prolonged higher interest rates supporting dollar strength market sentiment has shifted cautiously bullish with immediate resistance near the 104 zone where bulls may target further upside contingent on upcoming US labor market data and inflation reports which could either validate the breakout or trigger a deeper corrective move.
Mochamad Briend Mega Bayu Angkasa
#EURUSD 🇪🇺🇺🇸

📈 The AO (Awesome Oscillator) usually shows a clear momentum divergence when the ending diagonal is forming. This is a signal of weakening trend strength and signals a possible reversal.

📉 During the ending diagonal, AO often moves closer to zero with small, choppy bars. This supports that the pattern is nearing completion.

🔎 Now we will monitor the correction to trade the next impulse.

🔹 If you are not successful in planning, you will not be successful in trading. If your trading plan doesn’t go as planned, it doesn’t mean you failed to plan. On the contrary, it protects you from unnecessary trades. Just keep planning and re-plan it! !A trading plan that goes according to plan is the reward of trading!
Mochamad Briend Mega Bayu Angkasa
EURGBP has completed a five wave impulsive structure within a rising channel and is now correcting through a potential ABC pattern where wave a has already broken the internal trendline support and price is heading toward the lower boundary of the channel near the previous structural support zone market sentiment has shifted as risk-off flows increase due to concerns around global growth and potential rate cuts by the RBA while the Bank of Japan maintains its cautious stance technical rejection from the red supply zone marked by wave b adds confluence for continued downside and traders should monitor price action around the projected wave c zone for potential reversal signals aligning with fundamental shifts in risk appetite.
Mochamad Briend Mega Bayu Angkasa
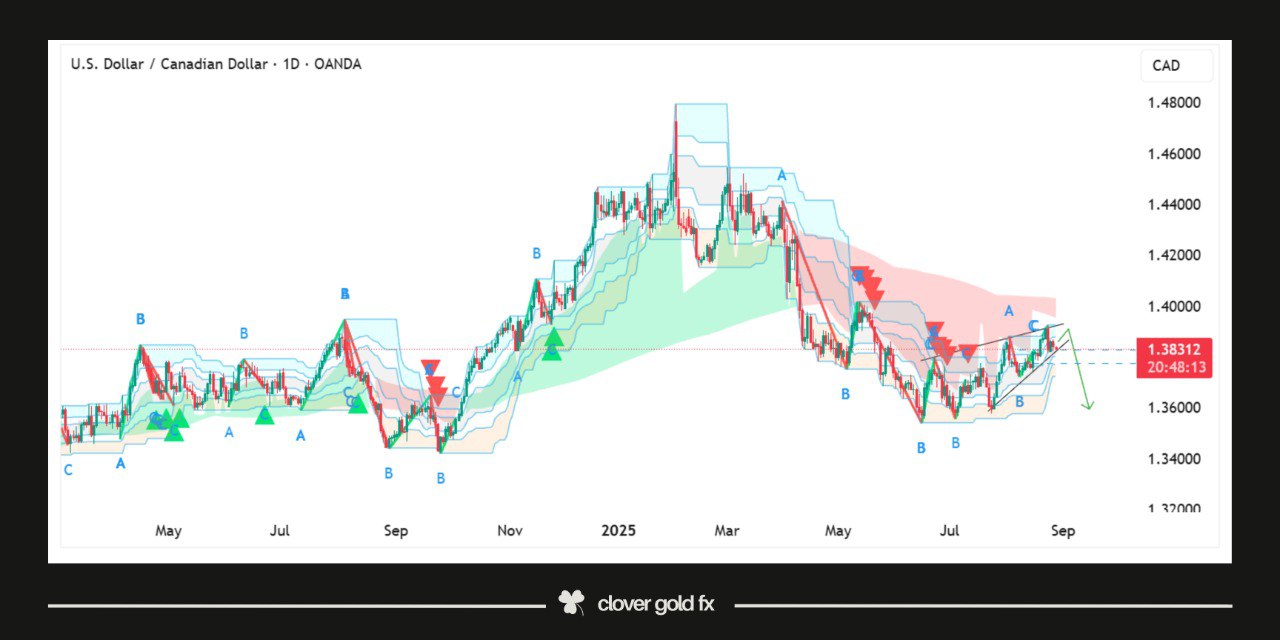
USDCAD on the 12H chart has completed a clear impulsive five wave decline followed by a contracting triangle correction labeled ABCDE, indicating a Elliott Wave continuation pattern after wave 5. Price is currently testing the upper boundary of the triangle near 1.37800, forming lower highs and higher lows within a well respected symmetrical structure. The rejection from point E aligns with declining momentum and suggests a bearish breakout is likely as price fails to gain bullish traction above the resistance zone. A breakdown below the lower trendline support around 1.36000 would confirm the continuation of the downtrend with potential targets extending toward the Support area.