Nuevos indicadores técnicos para MetaTrader 5 - 3

Versión Beta El indicador técnico Non Lag MA MTF (Non-Lagged Moving Average Multi-Time Frame) es una versión avanzada del Non Lag MA que permite visualizar la media móvil en varios marcos temporales simultáneamente. Pros: - Visión integral: Proporciona una visión más completa al mostrar la media móvil en diferentes marcos temporales en un solo gráfico. - Anticipación de tendencias: Ayuda a anticipar cambios de tendencia al observar la convergencia o divergencia de las medias móviles en distint
FREE
Buy DEMA 3 Scalp Indicator, Signaling and Trend Finder for Forex DEMA 3 indicator is a professional indicator for finding trends as well as finding entry and exit points for a symbol. This indicator is designed based on the DEMA indicator, which can tell you the signals accurately and quickly. The DEMA 3 indicator can give you accurate and early entry points for swings. Features of the DEMA indicator 3
Receive signals as notifications on the Metatrader mobile application. Receive signals by em

This indicator shows the strength of each currency compared to the US dollar by calculating the rate of change in price over a specified time period. When you open the indicator, you'll see a list of different currencies on the price chart. Each currency will have a numerical value indicating its strength level compared to the US dollar, where: If the value is higher than the US dollar, it will be displayed in green, meaning that currency is stronger than the dollar. If the value is lower than t
FREE

El indicador técnico Non Lag MA (Non-Lagged Moving Average) es una variante de la media móvil que busca reducir el retraso inherente a las medias móviles tradicionales.
Pros: - Menos retraso: Al estar diseñado para reducir el retraso, el Non Lag MA puede proporcionar señales más rápidas que las medias móviles tradicionales. - Tendencias claras: Las líneas del Non Lag MA muestran claramente las tendencias alcistas y bajistas, lo que facilita la interpretación de la dirección del mercado. - Per
FREE

This is a tool to estimate your probability of bankruptcy. features. estimate a probability of bankruptcy (Nauzer J. Balsara) from your trade history usually, it is small print and never interfere with trades alert in large prints and color when it exceed the alert level you can set parameters(i.e. winning ratio) fixed and simulate freely *1: this value is for reference only and is not guaranteed to occur.
FREE
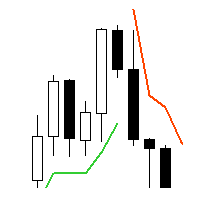
Supertrend - невероятно мощный и универсальный индикатор, предназначенный для помощи трейдерам в определении текущего тренда на конкретном торговом инструменте. С помощью двух встроенных индикаторов, Average True Range и Standard Deviation, трейдеры могут выбрать наиболее подходящий индикатор для своей стратегии торговли. Пользователи также могут настроить период этих индикаторов и выбрать цену (Close, High, Low, Open, Weighted), к которой он должен быть применен, с Typical price в качестве опци

This indicator draws the Parabolic SAR. Top and bottom lines with customizable colors. With an additional parameter called “Validate Signals”, which identifies false breakouts and changes the color of the line to gray.
Input Parameters: Step ( default is 0.02 ) Maximum ( default is 0.2 ) Applied Price High ( default is High price) Applied Price Low (default is Low price) Validate Signals (boolean value to filter out false breakouts, default is true)
FREE
Este indicador es un oscilador de escala semilogarítmica anclado. Los científicos de datos profesionales utilizan ampliamente una escala logarítmica para mapear con mayor precisión la información recopilada a lo largo de un período de tiempo, de la misma manera que MT5 mapea los datos de precios. De hecho, la lógica subyacente de este indicador se obtuvo gratuitamente de un científico biotecnológico extranjero.
Un gráfico log-log muestra valores logarítmicos en los ejes x (horizontal) e y (ve

Inicialmente este indicador foi elaborado e pensado para rastrear pontos ou velas onde há força de tendência. Como nas grandes descobertas, cheguei ao indicador que mostra principalmente velas de reversão, pontos de tensão, alta liquidez, resistência. O indicador traz simplificação ao gráfico, indicando todos os pontos onde possivelmente teríamos lta´s, ltb´s, médias móveis, bandas, ifr alto. O indicador não faz o gerenciamento de risco, apenas mostra as velas onde podem ocorrer reversão. Lembre
FREE

Advanced Market Analysis Tool : Dive into market depth with the MT5 Volume Profile Indicator. Seamless MT5 Integration : Perfectly compatible with the MT5 platform. Enhances Pro Thunder v9 : Integrates smoothly with Pro Thunder v9 for deeper market insights. Detailed Volume Analysis : Explore market dynamics through in-depth volume data. ️ Simple Installation : Easy-to-follow setup steps for quick integration with MT5. Efficient Single Chart Application : Best used on a single c
FREE

** All Symbols x All Time frames scan just by pressing scanner button ** *** Contact me after the purchase to send you instructions and add you in "Order Block group" for sharing or seeing experiences with other users. Introduction: The central banks and financial institutions mainly drive the market, Order block is considered a market behavior that indicates accumulation of orders from banks and institutions, then the market tends to make a sharp move(Imbalance) on either side once

Contact me for instruction, any questions! Introduction The Elliott Wave in technical analysis describes price movements in the financial market that are related to changes in trader sentiment and psychology. The 5 W Pattern (Known as 3 Drives) is an Elliott Wave pattern that is formed by 5 consecutive symmetrical moves up or down. In its bullish form, the market is making 5 drives to a bottom before an uptrend forms. In a bearish 5-drive, it is peaking before the bears take over. 5W Pattern S

This indicator identifies the global trend and has a powerful algorithm for filtering out any type of noise that can interfere with trend direction identification. A special filter shows areas of sideways trend, consolidation or flat, which allows you to avoid any uncertainties in the market movement vision and gives a clear understanding of the global trend movement.
This indicator has no analogues and gives it unique advantages in the analysis of price movements and determination of the dir

This is my version of the famous VWAP indicator.
Channel Group: Click Here
You get: - Default VWAP Line - First and second deviation zones - Previous day levels Very simple to use, one of the best tools for day trading. Can be used on any TF and on any symbol. Don't use for entries, use as a trend filter. Add supporting indicators
I would recommend to use the indicator on either 15M or 5M chart.
FREE
The " Session Control " indicator is designed to display trading sessions on a price chart. This allows the trader to see at what points of activity the most important trading sessions occur: Pacific, European, American and Asian. Each of these sessions is characterized by a certain volatility and activity in the market, which is important for making trading decisions.
Peculiarities: Displaying sessions : The indicator shows time periods on the price chart corresponding to different trading s

O indicador Supertrendingsignal imprime um sinal na tela indicando início de uma forte tendência. O sinal não mostra o ponto de entrada com melhor risco retorno, apenas faz a indicação de uma forte tendência. Foi idealizado a partir de um conjunto de médias móveis e volume. Parametros: Periodmalongo: Períodos da média longa Periodmamedio: Períodos da segunda media Periodmamedio2: Perídos da terceira media Periodmacurto: Períodos da média curta. PeriodATR: Períodos do indicador ATR para adequar
FREE

The "YK-LOT-SIZE" is a custom indicator for MetaTrader 5 (MT5) that displays the total lot sizes and profits for both buy and sell positions on the current chart. Key features of the indicator: It calculates the total lot sizes for all open buy and sell positions of the current symbol. It calculates the total profits (including commissions and swaps) for all open buy and sell positions. The indicator displays the information on the chart using two lines of text: "BUY Lots: [total buy lots] | BUY
FREE

El **Heiken Ashi Smoothed** es una versión suavizada del indicador técnico Heiken Ashi, que se utiliza en el análisis de gráficos de velas para identificar tendencias del mercado y pronosticar movimientos de precios. Este indicador se basa en el promedio de datos de precios para formar un gráfico de velas que ayuda a los traders a filtrar el ruido del mercado.
**¿Para qué sirve?** Este indicador se utiliza para identificar cuándo los traders deben permanecer en una operación y cuándo está por
FREE

Un indicador técnico de múltiples osciladores es una herramienta de análisis que combina varios osciladores para proporcionar una visión más completa de la dinámica del mercado. Los osciladores son fórmulas matemáticas que se calculan a partir de los datos de los precios y se representan gráficamente para ayudar a identificar la tendencia actual, el sentimiento del mercado y posibles puntos de giro.
**¿Para qué sirve?** Este indicador sirve para identificar condiciones de sobrecompra y sobrev
FREE

Brilliant Reversal Indicator for MetaTrader 5 - Your Ultimate Alert-Driven Trading Solution Unlock unparalleled trading success with the "Brilliant Reversal Indicator" tailored for MetaTrader 5. This powerful tool has been meticulously designed to empower traders by identifying critical reversal opportunities with lightning-fast alerts. Key Features: Precise Reversal Detection: The Brilliant Reversal Indicator for MT5 specializes in pinpointing potential trend reversals, providing you with a str

Description:
Heikin-Ashi-like swing oscillator candles. It can be used in the same way as RSI or Stochastic.
For example: Zero crossing. Above the zero line is bullish, below the zero line is bearish.
Overbought or oversold. 100 line is the extreme bought level, -100 line is the extreme sold level.
Divergences.
Time frame: Any time frame.
Instrument: Any instrument.

Este indicador imprime 2 médias com distância de 1 ATR (Average True Range) da média principal. As demais médias móveis só são mostradas se estiverem fora desse intervalo. Parâmetros: mediaprincipal = Média que será criado o intervalo, não será mostrada. mediasec1, mediasec2, mediasec3 = médias secundárias. periodatr: periodos do ATR Este indicador faz parte do Trade System MarketStrengthRadar
FREE

La **Media Móvil de Tercera Generación (TGMMA)** es una versión avanzada del indicador estándar de **Media Móvil (MA)**. Fue descrita por primera vez por Manfred G. Dürschner en su artículo "Gleitende Durchschnitte 3.0" (en alemán). Aquí están las características clave de la TGMMA:
1. **Reducción del Retraso**: - A diferencia de las MAs tradicionales, la TGMMA reduce significativamente el retraso. Se adapta más rápidamente a los cambios de precios, lo que la hace ideal para traders que bus
FREE

Buy CTS scalping indicator, provide buying and selling signals, automatic channeling and sending signals to mobile phones
Using technical analysis and price action methods and modern methods, CTS indicator can draw price channels and recognize price trends with high accuracy and issue entry and exit signals according to them. Traders can easily fluctuate using this indicator in different time frames and in different markets. With the CTS indicator, you can signal in different ways. This indicat

Brief Description: A powerful tool designed to display historical Open, High, Low, and Close (OHLC) price points for various essential time periods. Gain valuable insights into market behavior with a focus on yesterday, the day before yesterday, the previous week, and the previous month. The indicator not only provides a retrospective view of market dynamics but also serves as a powerful tool for recognizing liquidity zones. Features: 1. Comprehensive Timeframe Insights: · Visua

Introducing the Consecutive Green/Red Candle Alert Indicator for MT5 - Your Trend Spotting Companion!
Are you ready to take your trading to the next level? We present the Consecutive Green/Red Candle Alert Indicator, a powerful tool designed to help you spot trends and potential reversals with ease. Whether you're a new trader looking for clarity in the market or an experienced pro seeking additional confirmation, this indicator is your trusted companion.
Key Features of the Consecutive Gre
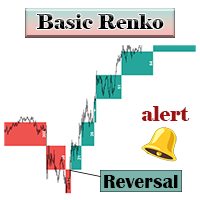
El indicador Renko básico muestra los cuadros de Renko en el gráfico principal.
Versión MT4
Su ventaja es que tienes acceso tanto al gráfico principal como al gráfico de Renko al mismo tiempo. Además, podrás saber cuántas barras se necesitaron para formar cada caja de Renko.
Cuando se produce una reversión, el indicador le notificará con alertas emergentes, push y por correo electrónico.
Este indicador no tiene configuraciones complicadas y tanto principiantes como profesionales pueden
FREE
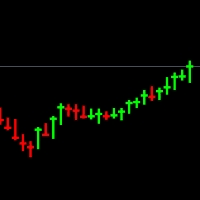
Nota: debe ocultar el tipo de gráfico existente; puede hacerlo cambiando los colores del gráfico; si no sabe cómo hacerlo, consulte este video: https://youtu.be/-4H6Z5Z4fKo o contáctame en priceaction9@outlook.com
Este es un tipo de gráfico que se mostrará en lugar de su gráfico, y solo muestra el máximo, el mínimo y el cierre, y tiene mechas gruesas. Le ayuda a comprender mejor cada vela al reducir el ruido introducido por los precios de apertura de cada vela.
Por ejemplo, en la escala de

This indicator draws the Donchian Channel, filling the background with colors. The color of the middle line is changed following the current trend, based on the standard interpretation of the Donchian Channel.
Input Parameters: Period of the Channel (default is 20) Validate Signals (boolean value to filter out false breakouts, default is false) Background Settings
Show Background (default is true) U ptrend Color (default is DodgerBlue ) Downtrend Color (default is Orchid) Background Tr
FREE
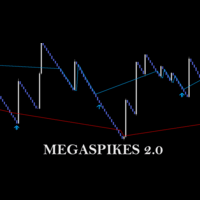
check out Megaclasic Spikes Robot here: https://www.mql5.com/en/market/product/109140 https://www.mql5.com/en/market/product/109140 MEGASPIKES BOOM AND CRASH v 2.0 NB: source codes of this indicator are available: PM me: https://t.me/Machofx The indicator is developed form a Studied combination of MA - Moving Average SAR - Parabolic Support and Resistance CCI - Commodity Channel Index
MegaSpikes 1.0 Download the 'MegaSpikes Boom and Crash' Technical Indicator for MetaTrader 5 in MetaTr
FREE

¿Estás listo para llevar tus operaciones al siguiente nivel? Presentamos WH Divergence Pro MT5 ,
un indicador de divergencia avanzado que le permite elegir entre una variedad de indicadores técnicos populares.
Ahora puede adaptar sus señales de divergencia para que coincidan con su estrategia comercial única. Contáctame después de la compra para guiarte a través de los procesos. Características clave :
Selección de indicador : elija su indicador preferido entre las siguientes opci

El tablero escanea las lecturas de dos indicadores: 'MACD' y 'Estocástico'. Muestra señales en tres columnas: para MACD, para estocástico y la columna resultante (si la señal es la misma para ambos indicadores). El escaneo se puede seleccionar en uno o más períodos de tiempo. Si desactiva todos los períodos de tiempo, el panel aún se cargará, pero con configuraciones específicas para tales casos. Las señales siempre se verifican para la barra cero (la barra cero es la barra más a la derecha en e

Gráfico de segundos para MetaTrader 5
Los indicadores le permiten crear gráficos en el terminal MetaTrader 5 con un período de tiempo en segundos. El período de tiempo en dicho gráfico se establece en segundos, no en minutos u horas. Por lo tanto, puede crear gráficos con un período de tiempo inferior a M1. Por ejemplo, S15 es un período de tiempo con un período de 15 segundos. Puede aplicar indicadores, asesores expertos y scripts al gráfico resultante.
Obtiene un gráfico completamente fun

non-repaint free MT5 technical indicator works on all timeframes 1 minute to the monthly timeframe the trade vision buy and sell arrow is a multi currency and synthetic indicator Trade vision buy and sell arrow comes with Push Alerts purple arrow look for selling opportunities white arrow look for buying opportunities. wait for candle to close and arrow to appear before taking any trades.
FREE

The indicator IQuantum shows trading signals for 10 symbols in the daily chart: AUDUSD, EURGBP, EURUSD, GBPCHF, GBPUSD, USDCAD, USDCHF, USDJPY, USDNOK, and USDSEK.
Signals of the indicator are produced by 2 neural models which were trained independently from one another. The inputs for the neural models are normalised prices of the symbols, as well as prices of Gold, Silver and markers of the current day.
Each neural model was trained in 2 ways. The Ultimate mode is an overfitted neural mo
FREE

BEHOLD!!!
One of the best Breakout Indicator of all time is here. Multi Breakout Pattern looks at the preceding candles and timeframes to help you recognize the breakouts in real time.
The In-built function of supply and demand can help you evaluate your take profits and Stop losses
SEE THE SCREENSHOTS TO WITNESS SOME OF THE BEST BREAKOUTS
INPUTS
MaxBarsback: The max bars to look back
Slow length 1: Period lookback
Slow length 2: Period lookback
Slow length 3: Period lo
FREE

SPREADEX e' un indicatore per MT4 e MT5 che indica la distanza dell'ASSET dal GP. il GP e' il prezzo del vero valore dell'ASSET sottostante ottenuto per stima. Il GP e' come una calamita, attira il prezzo dell'ASSET con alta probabilita' ed all'interno della stessa giornata di trading. Quindi SPREADEX indica quali sono gli asset piu distanti dal GP al momento in tempo reale. Fornendo un punto di vista al TRADER su quali asset concentrarsi e cercare eventuali segnali di inversione dei prezzi per
FREE

I present the well-known Moving Average indicator connected to the ATR indicator.
This indicator is presented as a channel, where the upper and lower lines are equidistant from the main line by the value of the ATR indicator.
The indicator is easy to use. The basic settings of the moving average have been saved, plus the settings for the ATR have been added.
Moving Average Parameters:
MA period Shift MA Method
Moving Average Parameters:
ATR TF - from which timeframe the values are t
FREE

Combination of Ichimoku and Super Trend indicators, with Signals and live notifications on Mobile App and Meta Trader Terminal. Features: Display five reliable signals of ARC Ichimoku Filter signals by their strength level (strong, neutral, weak) Send live notifications on Mobile App and Meta Trader terminal S ignals remain consistent without repainting Applicable across all time-frames Suitable for all markets Notifications format: "ARC Ichimoku | XAUUSD | BUY at 1849.79 | Tenken-Kijun cross |

Midpoint Bands is a channel-like indicator that draws two lines on the chart - an upper band and a lower band, pointing out possible reversal levels.
This is one of the indicators used in the Sapphire Strat Maker - EA Builder.
Sapphire Strat Maker - EA Builder: https://www.mql5.com/en/market/product/113907
The bands are simply calculated like this:
Upper Band = (HighestHigh[N-Periods] + LowestHigh[N-Periods])/2 Lower Band = (LowestLow[N-Periods] + HighestLow[N-Periods])/2
FREE

Combination of Ichimoku and Super Trend indicators. 1. ARC (Average Range times Constant) The concept of ARC or Volatility System was introduced by Welles Wilder Jr. in his 1978 book, New Concepts in Technical Trading Systems . It has since been adapted and modified into the popular Super Trend indicator.
The fundamental idea behind ARC is simple: to identify support and resistance levels, you multiply a constant with the Average True Range (ATR) . Then, you either subtract or add the resultin
FREE
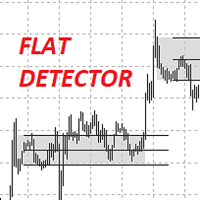
I present to you the IndFlatDetector indicator.
It belongs to the level indicators and shows the Trading Levels. This indicator combines the simplicity of intuitive settings and the accuracy of drawing levels.
Up count - the number of candlesticks up to determine the upper range
Down count - the number of candlesticks down to determine the lower range
Borders on the body or shadow - calculate the range by shadows or by body
Change the borders or not - change the boundaries of the orig

The Rayol Code Hour Interval Lines indicator was designed to assist your trading experience. It draws the range of hours chosen by the user directly on the chart, so that it enables traders to visualize price movements during their preferred trading hours, providing traders a more comprehensive view of price movements and market dynamics. This indicator allows the user to choose not only the Broker's time, but also the Local time. This way, the user no longer needs to calculate local time in
FREE

The well-known ZigZag indicator that draws rays based on the "significant movement" specified by the pips parameter. If a ray appears, it will not disappear (the indicator is not redrawn), only its extremum will be updated until the opposite ray appears. You also can display text labels on each rays describing the width of the ray in bars and the length of the ray in points.

Simple candle countdown - never again miss how much time is left to open a new bar!
This indicator doesn't plot any line on the chart - it uses only objects and calculates the time left to open a new bar.
You can set custom colors for the panel background and border and for the text color. Simple as that, the indicator is ready to use.
If you find any bugs, feel free to contact me.
FREE

The market structure indicator helps traders easily read market trends, this indicator shows trend continuity and trend reversals, this tool will be very useful for beginners who are just getting to know market structure, the indicator will provide visualization of the patterns that occur
Key Features: 1. BOS pattern: The indicator will provide an overview of the Break Of Structure pattern, where the pattern will indicate the continuation of the trend 2. CHOCH Pattern: The indicator will prov

The ZigZag Wave Entry Alert** indicator, created by Azad Gorgis in 2024, is designed for MetaTrader 5 and aims to provide traders with entry signals based on ZigZag patterns. Here's a brief overview of its functionality and key features:
Functionality:
- Detection of ZigZag Patterns: The indicator identifies significant price movements and outlines potential ZigZag patterns on the chart. It detects new highs and lows based on user-defined parameters such as Depth, Deviation, and Backstep. -
Limited time offer, 30 usd only!!!
Discover the unparalleled capabilities of MentFX's structural rules , now optimized for MT5 ! Our state-of-the-art algorithm is engineered to commence calculations from a robust dataset spanning 1500 bars from the current position . This meticulous approach ensures unparalleled accuracy and dependability in your trading endeavors. Experience the seamless integration of MentFX with MT5 , empowering you to analyze markets with precision and confidence. With Me
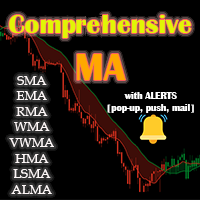
Acceda a una amplia gama de medias móviles, incluyendo EMA, SMA, WMA, y muchas más con nuestro indicador profesional Comprehensive Moving Average . Personalice su análisis técnico con la combinación perfecta de medias móviles para adaptarse a su estilo único de trading / Versión MT4
Características
Posibilidad de activar dos MAs con diferentes configuraciones. Posibilidad de personalizar la configuración del gráfico. Posibilidad de cambiar el color de las velas en función de las MAs cruz
FREE

El indicador muestra divergencia alcista y bajista. El indicador en sí (como el estocástico normal) se muestra en una subventana. Interfaz gráfica : En la ventana principal, se crean objetos gráficos "línea de tendencia", producidos desde el precio "bajo" hasta el precio "bajo" (para divergencia alcista) y desde el precio "alto" hasta el precio "alto" (para divergencia bajista). ). El indicador dibuja en su ventana exclusivamente utilizando buffers gráficos: “Principal”, “Señal”, “Punto”, “Co

** All Symbols x All Timeframes scan just by pressing scanner button ** *** Contact me after the purchase to send you instructions and add you in "Head & Shoulders Scanner group" for sharing or seeing experiences with other users. Introduction: Head and Shoulders Pattern is a very repetitive common type of price reversal patterns. The pattern appears on all time frames and can be used by all types of traders and investors. The Head and Shoulders Scanner indicator Scans All char

The Inversion Fair Value Gaps (IFVG) indicator is based on the inversion FVG concept by ICT and provides support and resistance zones based on mitigated Fair Value Gaps (FVGs). Image 1
USAGE Once mitigation of an FVG occurs, we detect the zone as an "Inverted FVG". This would now be looked upon for potential support or resistance.
Mitigation occurs when the price closes above or below the FVG area in the opposite direction of its bias. (Image 2)
Inverted Bullish FVGs Turn into P

Indicador muestra líneas de "Soporte" y "Resistencia" (estas líneas se dibujan usando el estilo de dibujo DRAW_LINE, es decir, no son objetos gráficos). La búsqueda de nuevos mínimos y máximos se realiza a la izquierda y a la derecha de la "barra de señal"; la "barra de señal" es el centro convencional de cada nueva construcción. ¿Por qué aparece la palabra Flexible en el nombre del indicador? Porque tenemos la posibilidad de especificar diferente número de barras a la izquierda ('Barras I

Simplify your trading experience with Trend Signals Professional indicator. Easy trend recognition. Precise market enter and exit signals. Bollinger Bands trend confirmation support. ATR-based trend confirmation support. (By default this option is OFF to keep interface clean. You can turn it ON in indicator settings.) Easy to spot flat market conditions with ATR-based trend confirmation lines. Highly customizable settings. Fast and responsive. Note: Do not confuse ATR-based trend confirmation
FREE

The indicator works to convert normal volume into levels and determine financial liquidity control points.
It is very similar in function to Fixed Volume Profile.
But it is considered more accurate and easier to use than the one found on Trading View because it calculates the full trading volumes in each candle and in all the brokers present in MetaTrade, unlike what is found in Trading View, as it only measures the broker’s displayed prices.
To follow us on social media platforms:
tel
FREE

Descubre el poderoso aliado que te guiará en el laberinto de los mercados financieros. Este indicador revolucionario te llevará de la incertidumbre a la claridad, permitiéndote identificar con precisión los puntos de inflexión del mercado. Mejora tus decisiones de entrada y salida, optimiza tus operaciones y ¡multiplica tus ganancias con confianza.
Ahora con alertas en tu pc o móvil
¡Para más información, te invitamos a unirte a nuestro canal de Telegram en https://t.me/Profit_Evolution ¡
FREE

I present the well-known Fractal indicator.
Levels have been added to this indicator.
At the extreme points, you can see the continuation of the price line, which changes when the values of the Fractal indicator change.
The indicator is easy to use. The basic Fractal settings have been saved.
FractalLevels Parameters:
LeftBars - the number of bars on the left
RightBars - the number of bars on the right
FREE

I present the well-known Moving Average indicator.
This indicator is presented as a channel, where the upper and lower lines are equidistant from the main line by a percentage set by the user.
The indicator is easy to use. The basic settings of the moving average have been saved and a percentage parameter (Channel%) has been added.
Basic parameters:
Channel% - shows how much we want to deviate from the main line.
The indicator is freely available.
FREE

Descubre el poderoso aliado que te guiará en el laberinto de los mercados financieros. Este indicador revolucionario te llevará de la incertidumbre a la claridad, permitiéndote identificar con precisión los puntos de inflexión del mercado. Mejora tus decisiones de entrada y salida, optimiza tus operaciones y ¡multiplica tus ganancias con confianza.
¡Para más información, te invitamos a unirte a nuestro canal de Telegram en https://t.me/Profit_Evolution ¡Allí encontrarás contenido exclusivo, a
FREE

El indicador técnico propuesto es un sistema de medias móviles de múltiples marcos temporales diseñado para ayudar a los operadores del mercado financiero a seguir de cerca los movimientos tendenciales. Al combinar medias móviles de diferentes períodos, este indicador ofrece una visión más completa de la dirección de la tendencia, lo que permite a los traders identificar oportunidades de trading con mayor precisión. Al utilizar este indicador, los operadores pueden maximizar sus ganancias al tom
FREE

To get access to MT4 version please click here . This is the exact conversion from TradingView: "Schaff Trend Cycle" by "everget". This is a light-load processing indicator. This is a non-repaint indicator. Buffers are available for processing in EAs. All input fields are available except fillings(due to graphical aesthetics). You can message in private chat for further changes you need. Thanks for downloading
OVERVIEW
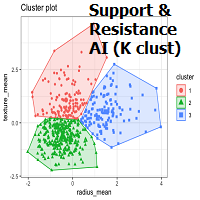
K-means is a clustering algorithm commonly used in machine learning to group data points into distinct clusters based on their similarities. While K-means is not typically used directly for identifying support and resistance levels in financial markets, it can serve as a tool in a broader analysis approach.
Support and resistance levels are price levels in financial markets where the price tends to react or reverse. Support is a level where the price tends to stop falling

Order Blocks are supply or demand zones in which big traders can find the comfort of placing large buy and sell orders and completing a big, very big transaction. Order blocks are a unique trading strategy that helps traders find a direction in the market. Usually, it allows traders to find out what financial institutions are planning to do in a particular market and better indicate the next price movement.

This indicator, named Edyx_Candle_Size, is designed to be used with the MetaTrader 5 trading platform. It displays the size of the candlestick body for the current timeframe as a histogram. The indicator does not provide any specific trading signals or recommendations
Measures the size of of the candlestick. That is the difference between the open and close as the case may be for either a bullish or a bearish candle. This can be use to filter out entry position as to maximise profit and minimi
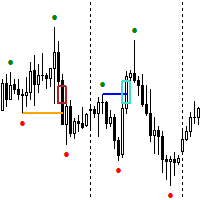
FREE EA for GOLD , Rejection Block Trader can be found here: https://www.mql5.com/en/market/product/116472 The Expert Advisor for this Indicator can be found here: https://www.mql5.com/en/market/product/115476 The Break of Structure (BoS) and Change of Character indicator with Fair Value Gap (FVG) filter is a specialized tool designed to enhance trading strategies by pinpointing high-probability trading opportunities on price charts. By integrating the BoS and Change of Character concepts wit
FREE

Escaner de Volatilidad Multimoneda en Tiempo Real Hola, traders. Les presento una solución única: el Escáner de Volatilidad Multimoneda en Tiempo Real. Este indicador es uno de los resultados de mi observación personal del mercado a lo largo de muchos años. Aborda varios puntos clave que enfrentan los traders: Seguimiento de Volatilidad en Tiempo Real: Elimina la necesidad de actualizar constantemente o cambiar de gráficos para ver dónde están ocurriendo movimientos significativos. Comprensió

The Expert Advisor for this Indicator can be found here: https://www.mql5.com/en/market/product/115445 The Break of Structure (BoS) and Change of Character indicator is a powerful tool designed to identify key turning points in price movements on financial charts. By analyzing price action, this indicator highlights instances where the market shifts from a trend to a potential reversal or consolidation phase.
Utilizing sophisticated algorithms, the indicator identifies breakouts where the str
FREE

Este indicador se crea para los comerciantes que se dieron cuenta de la necesidad de estudiar los cambios fundamentales en la economía en las tendencias globales de los mercados mundiales. Entender que no hay maneras fáciles en el mundo del dinero, tus probabilidades. Secret Fairway indicador está diseñado como una herramienta universal en el arsenal de comerciante, analista, inversor. Con él, puede crear su propio panel de control que refleja sus puntos de vista sobre la teoría y la práctica e

What is MACD?
MACD is an acronym for Moving Average Convergence Divergence .
This technical indicator is a tool that’s used to identify moving averages that are indicating a new trend, whether it’s bullish or bearish.
There is a common misconception when it comes to the lines of the MACD.
There are two lines:
The " MACD Line " The " Signal Line "
The two lines that are drawn are NOT moving averages of the price.
The MACD Line is the difference (or distance) between two moving
FREE

This indicator accurately identifies and informs market reversals and continuation patterns by analyzing and signaling the Three White Soldiers / Three Black Crows pattern. It also offers a "real-time backtesting" panel in the indicator itself in a way that every change made on the indicator parameters will immediately show the user how many signals are occurred, how many take profits and stop losses were hit and, by having these informations, the Win Rate and the Profit Factor of the setup b
El Mercado MetaTrader es la única tienda donde se puede descargar la versión demo de un robot comercial y ponerla a prueba, e incluso optimizarla según los datos históricos.
Lea la descripción y los comentarios de los compradores sobre el producto que le interese, descárguelo directamente al terminal y compruebe cómo testar el robot comercial antes de la compra. Sólo con nosotros podrá hacerse una idea sobre el programa, sin pagar por ello.
Está perdiendo oportunidades comerciales:
- Aplicaciones de trading gratuitas
- 8 000+ señales para copiar
- Noticias económicas para analizar los mercados financieros
Registro
Entrada
Si no tiene cuenta de usuario, regístrese
Para iniciar sesión y usar el sitio web MQL5.com es necesario permitir el uso de Сookies.
Por favor, active este ajuste en su navegador, de lo contrario, no podrá iniciar sesión.