Mira cómo encargar de forma rápida un robot comercial
Lea las reglas antes de empezar el trabajo
Cómo encargar un robot comercial en MQL5 y MQL4
Mire el ejemplo de Tarea Técnica para encargar un robot
Nuevas solicitudes en la categoría:
550+ USD
30 - 300 USD
30+ USD
30+ USD
Trabajo finalizado
Plazo de ejecución 4 días
Comentario del Ejecutor
wonderful client.. thank you for this.
Comentario del Cliente
Cleaned up my buggy indicator nicely.
Tarea técnica
So as the title suggest, I am looking for someone to debug and briefly explain my errors in my code.
The indicator looks like this on the chart
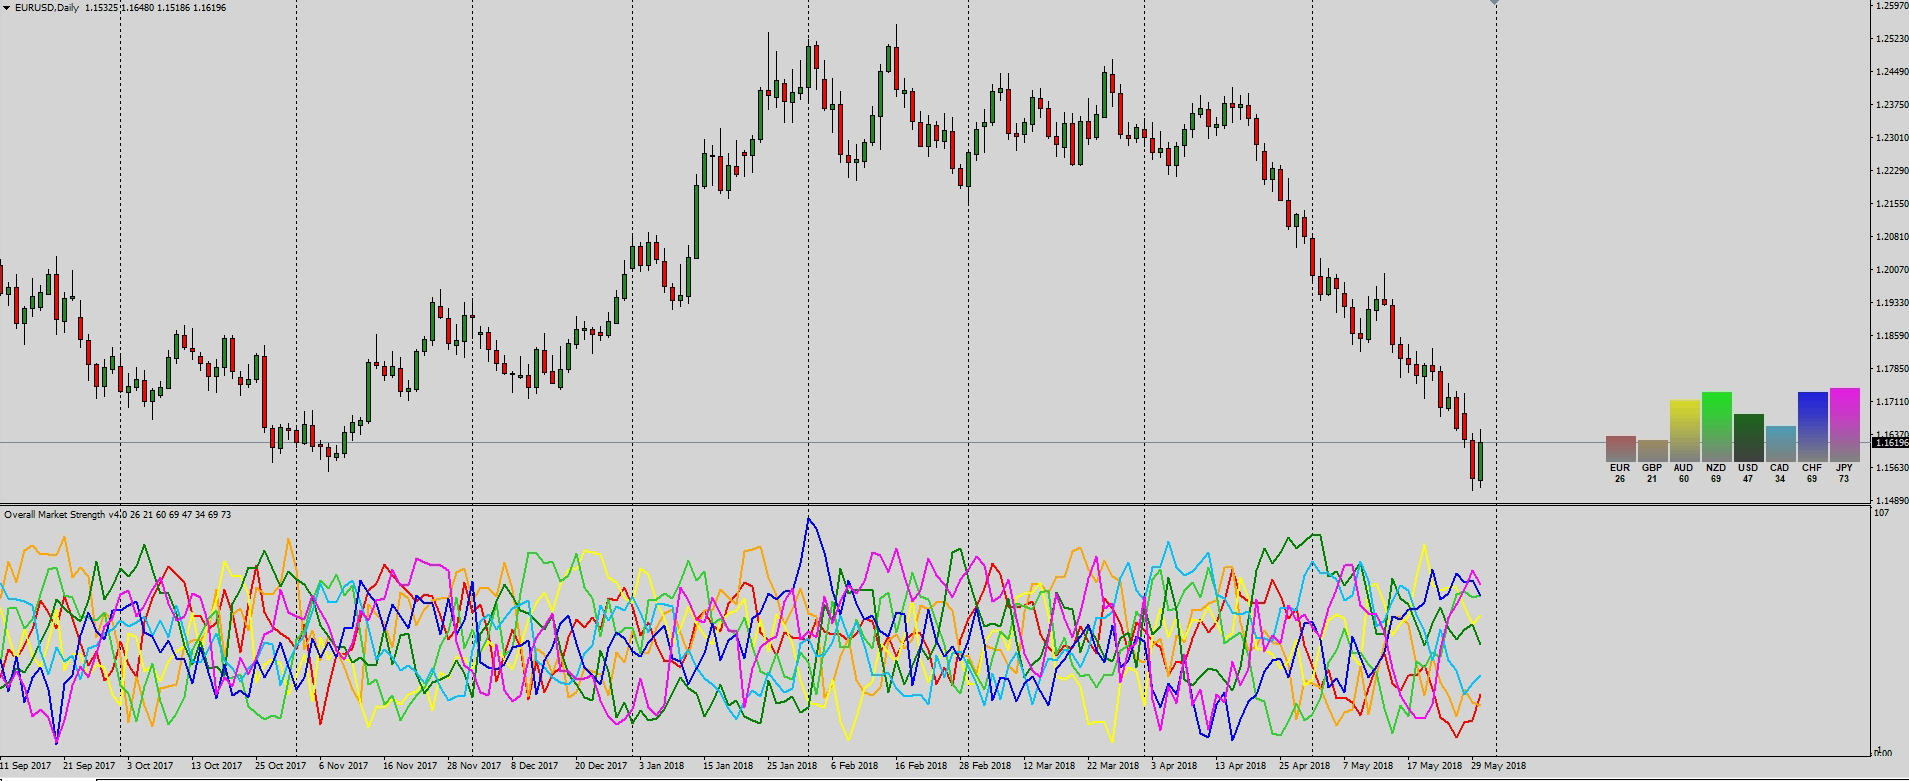
There are 4 bugs to fix
- Indicator applies to the chart fine but doesn't seem to run after initialization.
- Indicator only works on 1 hour charts and higher.
- Indicator "freezes" on start on new period.
- Graphic panel doesn't update to represent indicator value.
Examples of coding include the following
- Custom strength algo
   int   i,pos;

////---
   if(rates_total<=1)
      return(0);

////--- preliminary calculation
   if(prev_calculated>1) pos=prev_calculated-1;
   else  pos=1;

   for(i=pos-1; i<rates_total; i++)
     {double eg = 50 + (((iClose("EURGBP",0,i)-iClose("EURGBP",0,(i+Delta)))/(iHigh("EURGBP",0,(iHighest("EURGBP",0,MODE_HIGH,Delta,i)))-iLow("EURGBP",0,(iLowest("EURGBP",0,MODE_LOW,Delta,i)))))*100)/2;
      double ea = 50 + (((iClose("EURAUD",0,i)-iClose("EURAUD",0,(i+Delta)))/(iHigh("EURAUD",0,(iHighest("EURAUD",0,MODE_HIGH,Delta,i)))-iLow("EURAUD",0,(iLowest("EURAUD",0,MODE_LOW,Delta,i)))))*100)/2;
      double en = 50 + (((iClose("EURNZD",0,i)-iClose("EURNZD",0,(i+Delta)))/(iHigh("EURNZD",0,(iHighest("EURNZD",0,MODE_HIGH,Delta,i)))-iLow("EURNZD",0,(iLowest("EURNZD",0,MODE_LOW,Delta,i)))))*100)/2;
      double eu = 50 + (((iClose("EURUSD",0,i)-iClose("EURUSD",0,(i+Delta)))/(iHigh("EURUSD",0,(iHighest("EURUSD",0,MODE_HIGH,Delta,i)))-iLow("EURUSD",0,(iLowest("EURUSD",0,MODE_LOW,Delta,i)))))*100)/2;
      double ec = 50 + (((iClose("EURCAD",0,i)-iClose("EURCAD",0,(i+Delta)))/(iHigh("EURCAD",0,(iHighest("EURCAD",0,MODE_HIGH,Delta,i)))-iLow("EURCAD",0,(iLowest("EURCAD",0,MODE_LOW,Delta,i)))))*100)/2;
      double eh = 50 + (((iClose("EURCHF",0,i)-iClose("EURCHF",0,(i+Delta)))/(iHigh("EURCHF",0,(iHighest("EURGBP",0,MODE_HIGH,Delta,i)))-iLow("EURCHF",0,(iLowest("EURCHF",0,MODE_LOW,Delta,i)))))*100)/2;
      double ej = 50 + (((iClose("EURJPY",0,i)-iClose("EURJPY",0,(i+Delta)))/(iHigh("EURJPY",0,(iHighest("EURJPY",0,MODE_HIGH,Delta,i)))-iLow("EURJPY",0,(iLowest("EURJPY",0,MODE_LOW,Delta,i)))))*100)/2;


      EURBuffer[i] = (eg+ea+en+eu+ec+eh+ej)/7;

//--- and so
- graphic panel
//+------------------------------------------------------------------+
//|  Create Panel                                                    |
//+------------------------------------------------------------------+
void CreatePanel()
//+------------------------------------------------------------------+
  {
   string name="label_";

   for(int i=1;i<=24; i++)
     {
      string labelname=name+IntegerToString(i,3,'0');

      switch(i)
        {
         case   1:
            createBarGraph(labelname,264,43,30,2);
            break;
         case   2:
            createBarGraph(labelname,232,43,30,2);
            break;
         case   3:
            createBarGraph(labelname,200,43,30,2);
            break;
   //--- and so on
  }
//+------------------------------------------------------------------+

//+------------------------------------------------------------------+
//|  create Bar Graph                                                |
//+------------------------------------------------------------------+
void createBarGraph(string lname,int xdistance,int ydistance,int xsize,int ysize)
//+------------------------------------------------------------------+
  {
   int ypoint=ydistance;
   string name=lname+"_";

   for(int num=51; num>=1; num--)
     {
      createRectangleLabel(name+IntegerToString(num,2,'0'),xdistance,ypoint,xsize,ysize);
      ypoint+=2;
     }
  }
//+------------------------------------------------------------------+

//+------------------------------------------------------------------+
//|  Create Rectangle Label                                          |
//+------------------------------------------------------------------+
void createRectangleLabel(string name,int xdist,int ydist,int xsize,int ysize,)
  {
   ObjectCreate(name,OBJ_RECTANGLE_LABEL,0,0,0);
   //--- and so on
  }
//+------------------------------------------------------------------+

//+------------------------------------------------------------------+
//|  Create Edit                                                     |
//+------------------------------------------------------------------+
void createEdit(string name,int xdist,int ydist,int xsize,int ysize,string text,int fontsize,color clr)
//+------------------------------------------------------------------+
  {
   ObjectCreate(name,OBJ_EDIT,0,0,0);
   //--- and so on
  }
//+------------------------------------------------------------------+
- graphic panel update
      objectSetBlank("label_001");
      objectSetGraph("label_001_",EURBuffer[0],C'128,128,128',C'134,121,121',C'140,115,115',C'147,108,108',C'153,102,102',C'159,96,96',C'166,89,89',C'172,83,83',C'179,77,77',C'185,70,70',C'191,64,64',C'198,57,57',C'204,51,51',C'210,45,45',C'217,38,38',C'223,32,32',C'230,25,25',C'236,19,19',C'242,13,13',C'249,6,6',C'255,0,0');
      ObjectSetString(0,"label_017",OBJPROP_TEXT,DoubleToString(EURBuffer[0],0));
- Set graph
//+------------------------------------------------------------------+
//|  object Set Graph                                                |
//+------------------------------------------------------------------+
void objectSetGraph(string name,double value,color a,color b,color c,color d,color e,color f,color g,color h,color i,color j,color k,color l,color m,color n,color o,color p,color q,color r,color s,color t,color u)
  {
//---
   ObjectSet(name+"51",OBJPROP_COLOR,a);
   if(value > 2.0) ObjectSet(name + "50", OBJPROP_COLOR, a);
   if(value > 4.0) ObjectSet(name + "49", OBJPROP_COLOR, b);
   if(value > 6.0) ObjectSet(name + "48", OBJPROP_COLOR, b);
   if(value > 8.0) ObjectSet(name + "47", OBJPROP_COLOR, c);
   if(value > 10.0) ObjectSet(name + "46", OBJPROP_COLOR, c);
   if(value > 12.0) ObjectSet(name + "45", OBJPROP_COLOR, d);
   if(value > 14.0) ObjectSet(name + "44", OBJPROP_COLOR, d);
   if(value > 16.0) ObjectSet(name + "43", OBJPROP_COLOR, e);
   if(value > 18.0) ObjectSet(name + "42", OBJPROP_COLOR, e);
   if(value > 20.0) ObjectSet(name + "41", OBJPROP_COLOR, f);
   if(value > 22.0) ObjectSet(name + "40", OBJPROP_COLOR, f);

//--- and so on
The full code is 440 lines and will be provided upon expression of interest.
Thank you for your time
Bob
Han respondido
1
Evaluación
Proyectos
507
40%
Arbitraje
159
17%
/
74%
Caducado
99
20%
Trabajando
2
Evaluación
Proyectos
210
40%
Arbitraje
90
20%
/
43%
Caducado
85
40%
Libre
3
Evaluación
Proyectos
744
56%
Arbitraje
48
31%
/
31%
Caducado
120
16%
Libre
Ha publicado: 1 ejemplo
4
Evaluación
Proyectos
93
34%
Arbitraje
10
40%
/
30%
Caducado
5
5%
Libre
Solicitudes similares
I need ea that can trade in points
30 - 40 USD
Hi there developer, I need someone who can create an trading ea that place order in points using an. Vps with an stop loss in 2 point behind the order price automatically it close order in 1 point if the market reverse
Mac200
50+ USD
I need a Trend following Bot. Here we took entries by looking at two indicator which are 200 period ema and 12 26 9 MacD. Rules for entry exit are: Buy trade: When market is above 200 ema and MacD Line cross over the signal line and this cross over happened below the zero line of MacD indicator. We simply put Buy trade. Sell trade: When market is below 200 ema and MacD line crosses below the signal line and this
1. The general process is: Automated online forex marketing to find potential clients -> Answering potential clients' questions -> Converting them into actual clients -> Opening accounts, depositing funds, and copying trades. 2. Developers could implement an AI Digital Twin/Shadow Agent to answer customer questions, eliminating the need for me to answer customer inquiries. 3. I have a CTA website and I'm manually
Iconic Boy
300 - 400 USD
Am looking for a bot to trade .so that I can be able to trade and become very successful and make some profit so that I cannot sleep on a empty stomach
Macd Rsi stochastic vwap Bot. I have code.
150 - 300 USD
Привіт. Шукаю когось, хто б застосував мій код як бота . Я торгую індексом Aus_200 SFE (не XJO). Бот базується на MACD входу/виходу, RSI, стохастиці та vwap. Як тільки роботу приймуть, мені потрібно внести кілька коректив; однак, нічого суттєвого. Дякую
Custom MT5 EA for buy stop and sell stop breakout strategy.’ ‘Requirements, develop a custom Expert Advisor for MetaTrader 5 that places buy-stop and sell-stop pending orders based on defined breakout rules.’ ‘All important values adjustable via inputs.’ ‘Includes stop loss, take profit, trailing stop, and configurable risk management.’ ‘One trade at a time, works on demo before live.’ Provide source code and
A good trend predicting indicator is the one which can identify the trend change as soon as it happens on the chart. when a new candle is formed it should tell whether its going to go up or down. I have already seen a lot of repainting trend predictors so if your indicator is repainting then please don't bother contacting. I would like to see the demo version and then if satisfied , I would want the source code too
Platform MetaTrader 5 (MT5) MQL5 Source Code Required Compatible with Exness MT5 both standard and cent accounts/ICMarket accounts Works on EUR/USD only (initial version) ⸻ Objective Develop a fully automated AI Expert Advisor based on ICT Smart Money Concepts (SMC). The EA must only execute high-probability trades that satisfy all required conditions before opening a position. The EA must avoid overtrading and
Création d'un robot sur MQL5
630 - 640 USD
Bonjour, je recherche un développeur MQL5 expérimenté pour créer un Expert Advisor pour MetaTrader 5 basé sur une stratégie de trading intégrant des principes de gestion des risques rigoureux et d'intelligence financière. Le robot doit être capable de gérer plusieurs paires de devises et d'optimiser automatiquement les entrées et sorties en fonction de conditions de marché prédéfinies."
MT4/MT5 HFT EA us30
30 - 3000 USD
Hello everybody, I'm looking for an experienced MQL4/MQL5 developer to optimize a High-Frequency Trading (HFT) Expert Advisor for both MT4 and MT5. The EA performs consistently and profitably on demo accounts, but when it is run on Raw and Standard live accounts under what appear to be the same trading conditions, it begins generating losses. I do not have the original source code (.mq4/.mq5); I only have the
Información sobre el proyecto
Presupuesto
30+ USD