 Todos los encargos
 Reglas
Trabajo finalizado

Tarea técnica
Hello Everyone,
I need a real professional who can create the same indicator that already exists such as GraphOnGraph (GoG) seen here. Although it is an extremely simple indicator you need to be very familiar with it or look at it if you haven't seen it before, particularly the coding and the mathematics behind it.
*** Please note I need this done within 5 days or less from acceptance as it is very urgent. If you complete it within 3 days there will be a 20% bonus! ***
I will be using the same developer to enhance this indicator later and to turn this into a robot with a Money Management Strategy System (MMSS). And after that, also another MAJOR project involving the development of a multi-indicator matrix (adding to this one), where this will also be turned into an EA Robot with MMSS.
No newbies, only established professionals please. I don't have time to try out developers. I will be paying good money as time goes on so please don't waste my time. I've wasted enough as it is!
As for this indicator, I need a lot of extra modifications to the existing (GoG) version. There will be 2 parts to this indicator.
1. A GRAPH showing multiple symbols on one frame like the GoG. (With the current GoG version you can add multiple GoGs on one timeframe).
2. An ALL IN ONE DASHBOARD.
1. GRAPH showing multiple symbols:
Pretty much like the GoG version but with the options to change its view via the Dashboard as described further down.
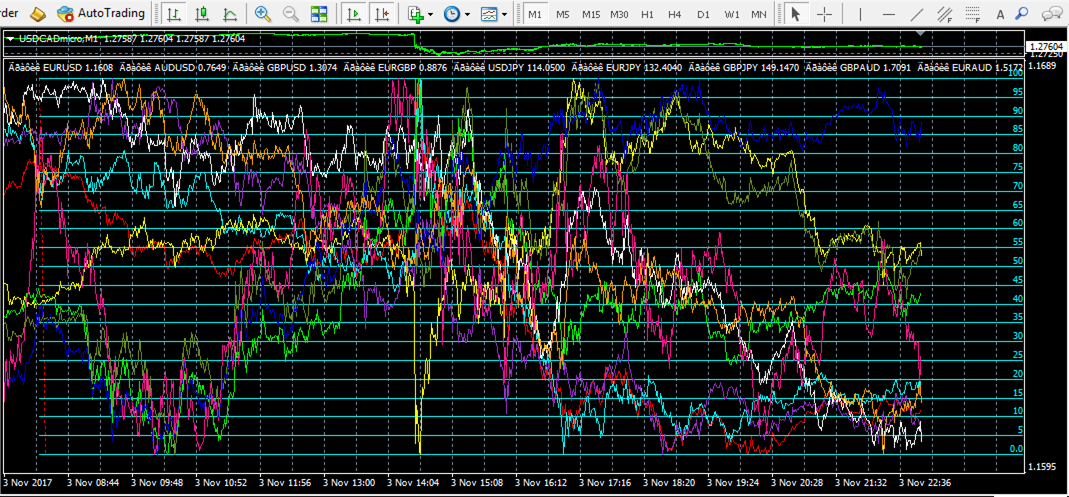
As you can see I have added all 10 pairs onto one graph with different colours for each. I then added a scale from 0-100 from top to bottom extremes. This was for the M1 timeframe. If you noticed the extreme tops and extreme bottoms are good indicators of reversal for that timeframe. If a pair tops out then I know it will most like head down until it reaches the bottom. I measure where it's at using a matrix (as shown below) but I do this manually which takes too much time. That's why I need you to develop it for me automatically.
Notice also that there is a figure at the top right (1.689) and one at the bottom right (1.1595). This is the cumulative value of all pairs but I need you to explain to me mathematically how this calculates in a basic manner.
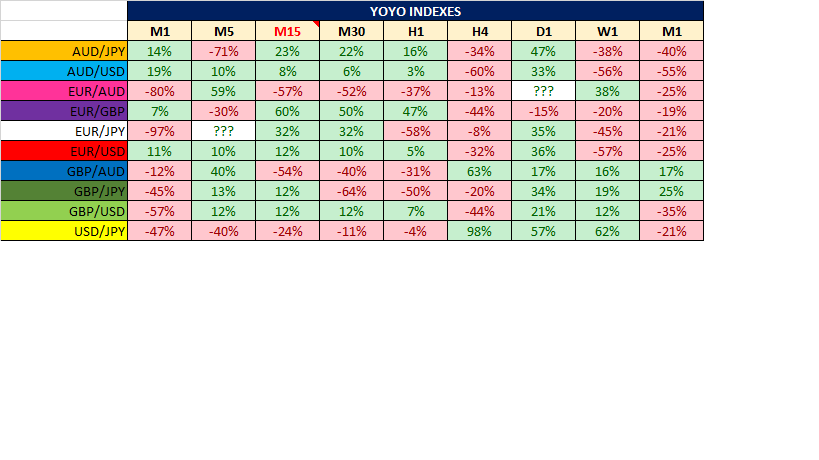
Please see the matrix (below) where I entered values for the graph manually.
Another thing that is important... notice when you have 10 pairs on one graph, you zoom out and set the scale, right? You can clearly see nice and straight bottom and top, but... as soon as you scroll or zoom, those bottoms and tops change. Notice that?
The calculations in the matrix panel needs to be exactly the same as the graph as I showed, otherwise it becomes something different and I don't want that.
The panel/matrix needs to emulate the graph exactly. And it needs to emulate it with full zoom out only.
2. ALL IN ONE DASHBOARD
The dashboard will have several sections:
- the main matrix table of symbols (currency pairs, commodities, shares etc) with all time frames (M1-MN) showing where they are on the graph - see table image above. It must also allow for indices and commodities and shares if needed as long as the symbol name is entered. There should be an "add symbol" button under the last existing symbol where a text box opens. Once entered a new row for that symbol will be added. The list should be able to add up to 50 symbols in the mix and be seen visually on a single chart with different colours for each. The chart should be separate to the dashboard as it needs to be enlarged for a good view.
- another settings section for basic visual viewing options (open/high/low/close -- candlestick/line/ohlc bar etc).
- a graph showing all selections like the existing indicator (GoG) but with an option to view as line/open/close/high/low/ohlc with buttons available on the dashboard in the settings section, which will also be visible.
- currency pairs (or stock indices) can be added via the dashboard by adding rows via a button.
- the ability to open a chart for any currency pair or indices by clicking a button.
- the ability to hide/show symbol on live graph/chart but still keep it in the main matrix table. The reason for this is because sometimes you can't see if a particular pair has topped out or bottomed out due to other colours in its way.
- the main table shows index value for each time frames with green going up (+1% to +100%) and red going down (-1% to -100%).
- it needs to be fast and not slow down the computer or MT4 itself.
- I will need some basic advice/education about how the limits/calculations work when you add multiple currency pairs to the same chart.
- code must be hidden and un-readable and un-crackable. You must show me or leave instructions on how to show them if needed later.
- basic logo. The name of this indicator will be provided to the winning developer.
- notifications to email or phone when any symbol or timeframe (in the matrix) approaches top or bottom extreme.
Thank you and good luck to all of you.