Trabajo finalizado
Tarea técnica
This is a modification to the Triangular Moving Average non-repainting Indicator (provided as attached MQ4 file). The attached EXE file gives you some idea as to some of the design modification I need done to this indicator. The attached images are of the same images used in this job description just in case they are hard to read. This job is for the MQ4 code and not just the compiled exe file and is part one of a big project.
1) This Indicator will mainly be running on Renko charts. All examples shown are on Renko charts.
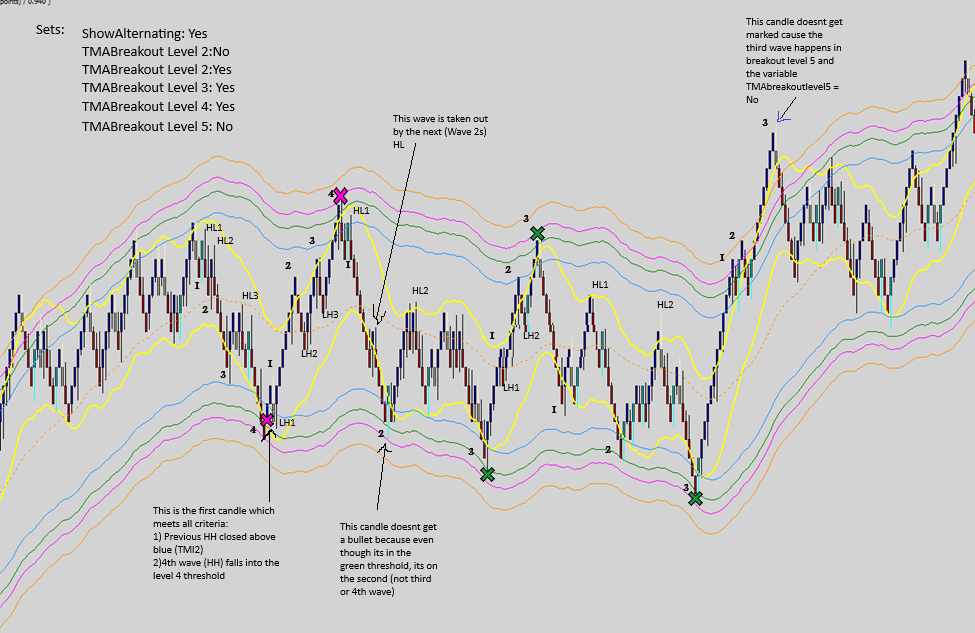
2) 5 TMI settings, each with different colors instead of one (see EXE file as an example). The default settings for the variables values are as follows:
1) TMA1: ATR Multiplier1, Half Length 1, ATR Period 1 = 1.5,19,70,
2) TMA 2: ATR Multiplier2, Half Length 2, ATR Period 2 = 2.5,60,120
3) TMA3: ATR Multiplier3, Half Length 3, ATR Period 3 = 3.0,60,120
4) TMA4: ATR Multiplier4, Half Length 4, ATR Period 4 = 3.5,60,120
5) TMA5: ATR Multiplier5, Half Length 5, ATR Period 5 = 4.0,60,120
6) ColorTMABands1 = Yellow, TMABands2= DodgeBlue, ColorTMABands3= Green, ColorTMABands4= Magenta ColorTMABands5=Black
7) TMABreakoutLevel 1: Yes/No, Default “No”, TMABreakoutLevel 2: Yes/No, Default “No”, TMABreakoutLevel 3: Yes/No, Default “No”, TMABreakoutLevel 4: Yes/No, Default “No”, TMABreakout Level 5: Yes/No, Default “Yes”
8) MaxBars: Default 10,000
9) EnableAlerts: Yes/No Default No
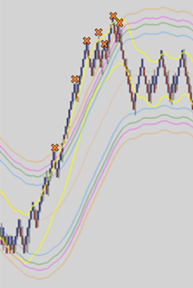
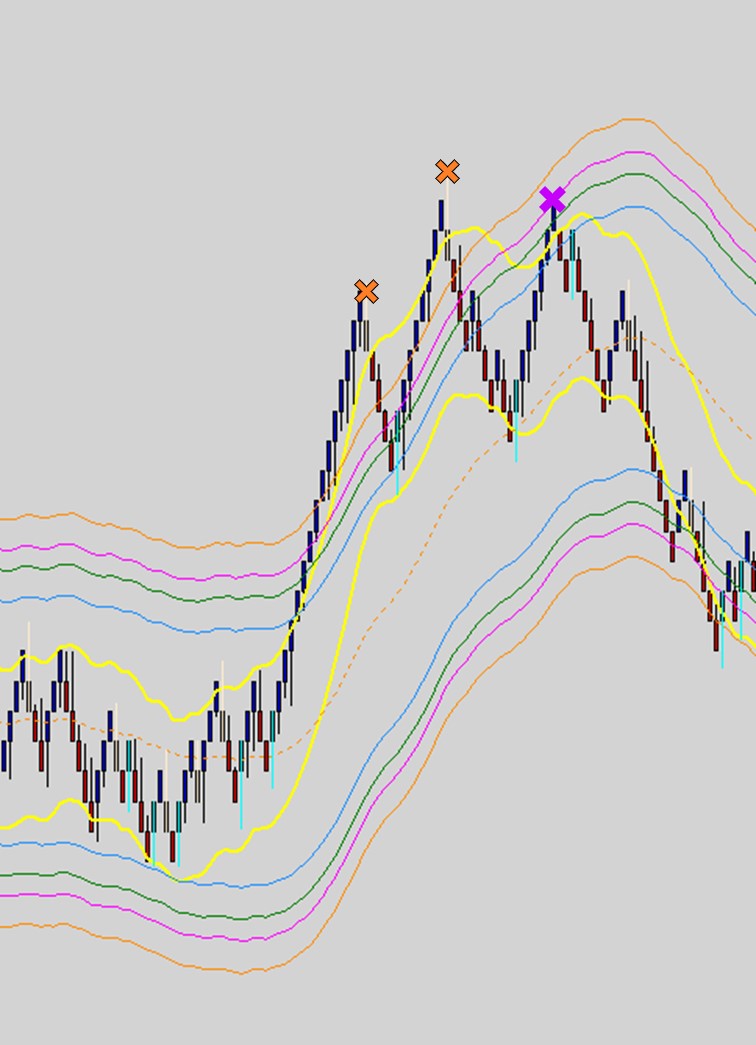
3) When a Bullish bar breaks above a breakout level, the indicator will show an “X”, indicating a potential downward reversal. In Renko chart, this coincides with when the Renko blocks reverse position once it has crossed a particular TMI band. This program needs to mark the change in direction of the candles and rejection of the upward or downward moves after the candle closed above the TMI bands and mark each rejection candle with a different color “X”. For the purpose of this illustration, I will refer to those “X”s as“Bullets”. I do not know if you need a variable assigned for the size of the Renko Blocks I use, but if you do, my default is value is 5 pips blocks, but I do change that size on occasion. Here are the values for other variables used in this indicator:
1) ColorCandleReversal1 = Yellow, ColorCandleReversal2= DodgeBlue, ColorCandleReversal3= Green, ColorCandleReversal4= Magenta ColorCandleReversal5=Black
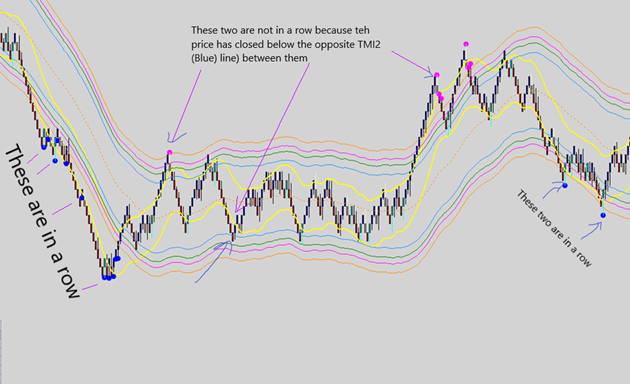
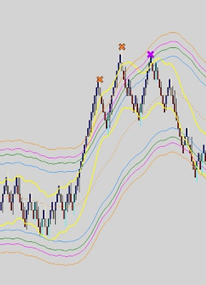
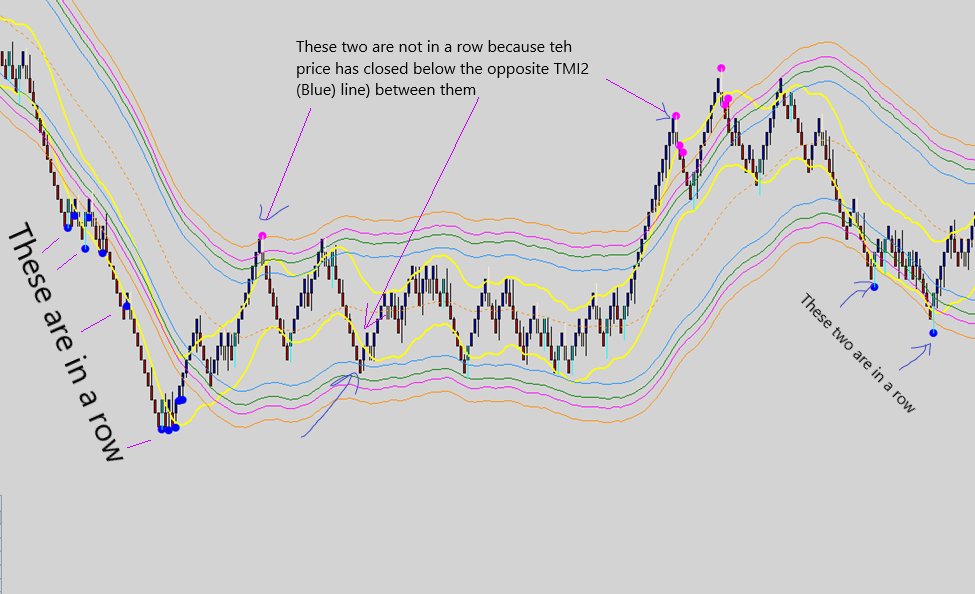
4) Generally speaking, this program needs to be able to filter out Bullets and only show the bullets in groups that meet my filtering criteria ( Bullets are considered to be in a the same group when several bullets are in a row and the price candles between those bullets hasn’t broken and closed past the opposing TMA2 line (TMI2 has a DodgeBlue color by default) See examples Below:
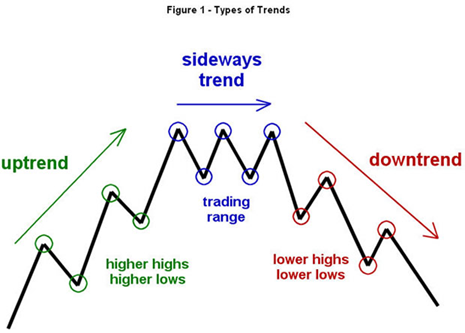
5)But before we get to the filters, wed need to incorporate a way of counting the number of Waves (from Elliot Wave Theory) the uptrend and downtrend moves as well as the ranging moves are producing. For this portion of the indicator, I will be referring to the following abbreviations for Higher High and Higher Low and Lower High and Lower Low:
1
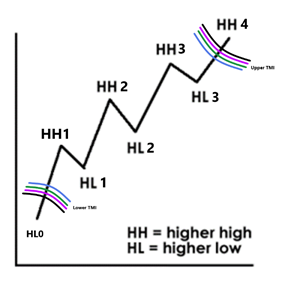
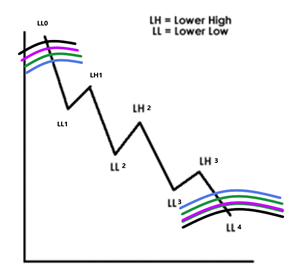
The rules that must always hold for the pattern above to be valid are:
HH1>HH0 and HL1<HH1 and HL1>= HH0. The remaining HH and HL and LL and LH rules can be deduced from this rule as per the images above. (From programing aspect, in order to distinguish the correct waves (HH and LL, etc) , I’d suggest using a three candle based Fractal code to point out ALL of the three candle based highs and lows in the price movement and then filter out the ones that don’t meet with the rules above. This will be further explained below.
Now How do we distinguish trending vs ranging moves and Uptrend vs downtrend:
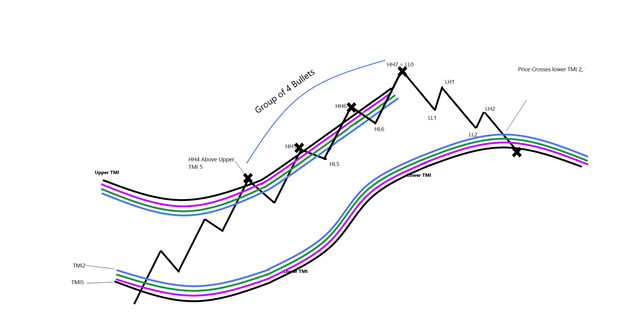
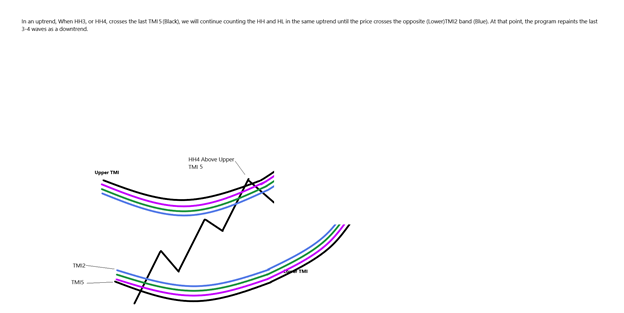
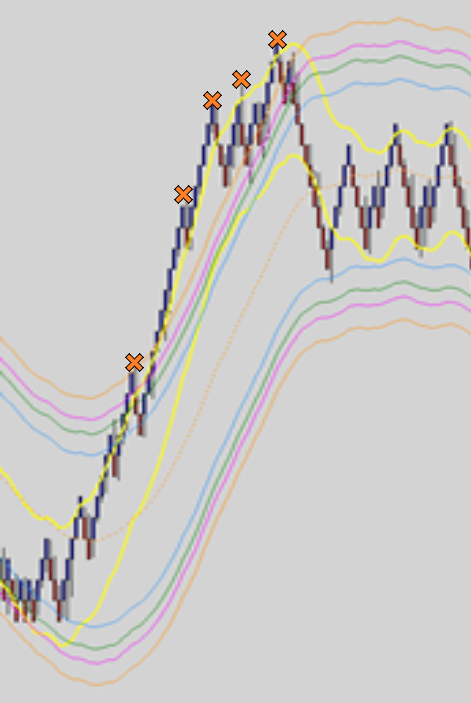
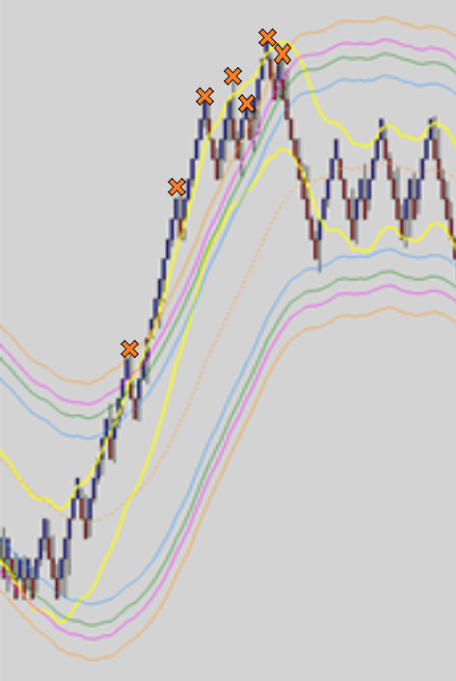
An uptrend move is a move where HH3 or HH4 or LL3 or LL4 close above the last TMI band (TMI5). When this happens on the upper TMI for example, multiple upper TMI5 crossings in a group is expected before the price crosses the lower TMI and trend reverses or becomes ranging.
Example:
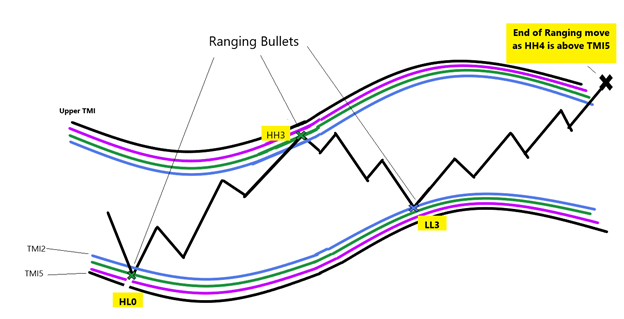
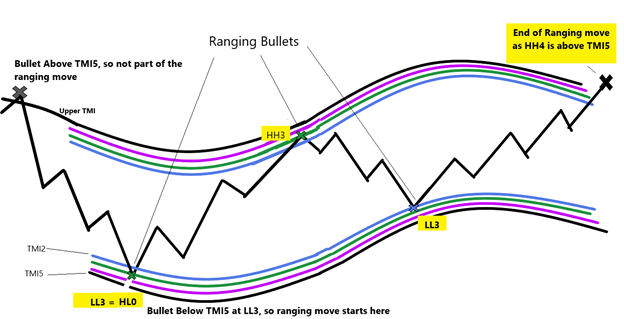
In a ranging move, HH3 or HH4 or LL3 or LL4 do not reach TMI5 and at most will reach TMI4 at best. This will result in a ranging bullets of the lower grade TMI (ie TMI 2, TMI3, TMII4) from Upper to Lower TMI and back from Lower to Upper TMI with Single bullets separated by crossing of the opposing TMI2:
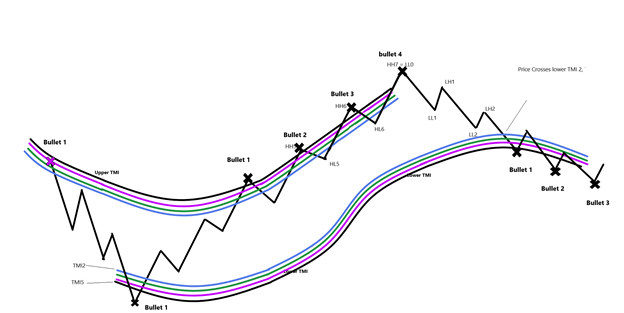
How to correctly assign the waves to trending moves: I am going to show you step by step how the program needs to number the waves in an uptrend such as this one:
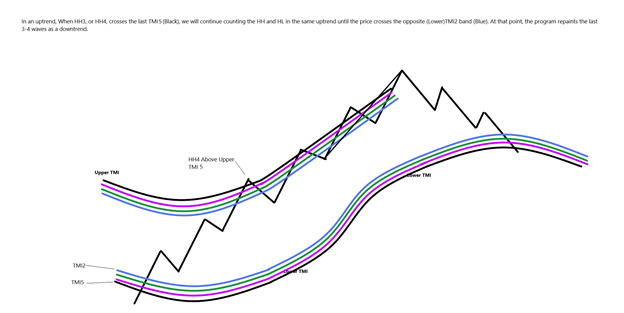
In order to establish where HL0 is, we wait for the price to cross low TMI2. We go back X number of candles (Default X = 20), find the lowest Fractal within the 20 candles and call that Hl0. Then from there, we start counting HH1 that meets with the rules we set out above, HL1, etc Until we get to HH3 or HH4 that has broken through the TMI upper. If HH3 or HH4 has crossed Upper TMI 5, we expect an uptrend and a group of bullets on the upper TMI band to show up, so we continue the HH count upwards:
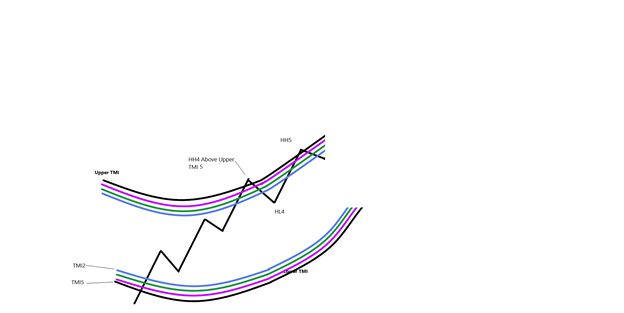
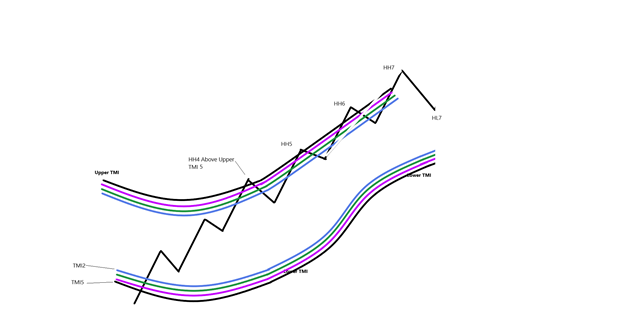
Note that anytime any HL goes below the previous HL, waves need to be renumbered to continue to follow the uptrend rules as is seen below
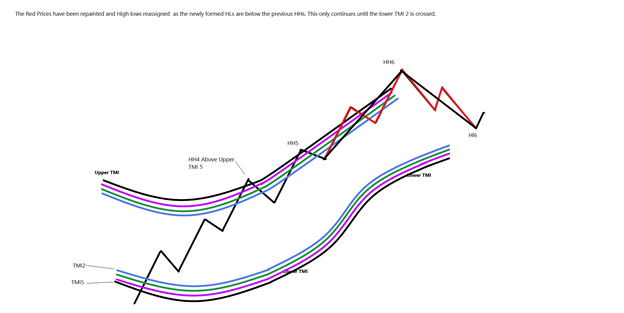
When the price finally crosses the lower TMI2 line (Blue), the last move between the upper TMI and lower TMI needs to be repainted as a downtrend and the previous uptrend move repainted as seen below:
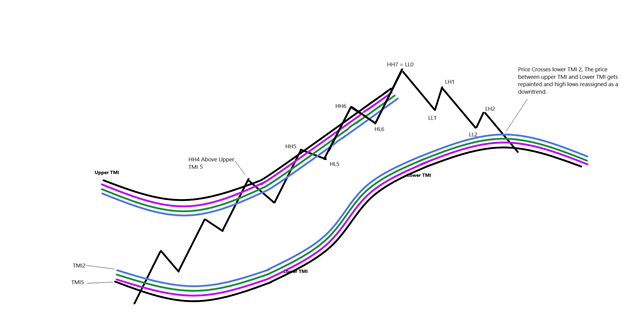
In the last downtrend move, if LL3 or LL4 end up below the lower TMI5 band, that will be considered to be a Down trend. And if it doesn’t cross TMI5, it will be a Ranging move. How to correctly count the wave in a ranging move:
Anytime an HH4 or LL4 is has crossed TMI2 through TMI 4 4 but not 5, we consider that a ranging move. The first bullet is HL0 or LL0 and we start counting up or down in the opposite direction of the TMI band all the waves after that:
Now back to the filters: in the first filters, we will only pick the series of bullets in sequence or group (Trending move) (bullets are considered to be in a group when there is no crossing of the opposing TMI2 band in between the bullets). To understand the filters, we will need to refer to number the bullets in group as follows:
1) Variables: ShowInGroupsof3: Yes/No Default Yes
2) Variables: ShowInGroupsof4: Yes/No Default Yes
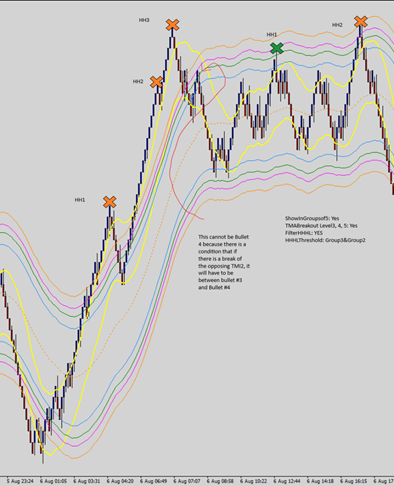
3) Variable: ShowInGroupsof5: Yes/No Default Yes (When this option is chosen, one crossing of the opposing TMI2 band is allowed, but it has to be between bullets #3 and #4)
4) Variable: ShowAlternating: Yes/No/Default No, This option only shows ranging prices when the price alternatingly breaks the opposing TMI2 on the 3rd or 4th HH LL. (Whichever number, 3rd or 4th wave which is in the chosen threshold first) See example below for clarification.

6) When Price Moves from One TMI to the opposite TMI Without creating a wave (no HH or LL) in between, consider that move to qualify for all 4 waves (ie all HH1, HL1, HH2, HL2, HH3, HL3, HH4 are all within the straight move). See Example:
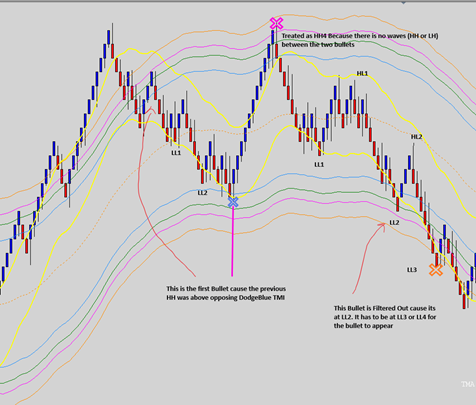
7) In a chosen Group of bullets (When ShowInGroupsof: 3,4,or 5 picked), If there are multiple clusters of Bullets within the same threshold, then need option to only chose one from each cluster based on HH, HL, LH,LL
1) Vaiable: FilterHHHL: YES/No Default: Yes
2) Variable: HHHLThreshold: Group2/Group3/Group4/Group5/Group3+Group2; Default Group3+Group2
HHHLThreshold=Group 2 allows to sort out Bullet 1 and Bullet 2 based on HH, LL positions.
HHHLThreshold=Group 3 allows to sort out Bullet 1 thru 3 based on HH, LL positions. And so on and so forth
HHHLThreshold=Group 3+Group2: This Option can only be applied when ShowInGroupsof= 5 is picked. It allows for the HHLL filter to only be applied to the first 3 bullets independent of the last two bullets (ie, in an upward move, Bullet 3 is above Bullet 2 which is above Bullet 1 and Bullet 5 is above Bullet 4. But Bullet 4 can be both below or above bullet 3. See example below.
· Example of what the filter should do: When FilterHHHL = No, and TMABreakout Level 5 is “Yes”:
· When FilterHHHL = YES, and TMABreakout Level 5 is “Yes”: HHHLThreshold:Group5

· In the previous example, if HHHLThreshold: Group3 (all bullets are taken out cause the third bullet has a lower HH than the second one and ShowInGroupsof: 3, only shows groups of three bullets.
· In this last example, HHHLThreshold:Group3+Group2 and ShowinGroup5=yes
8) When Groups of bullets chosen (When ShowInGroupsof: >1), I’d like to have the option to
Toggle off and on the distance in points between each bullet and the TMI2 (Blue) band and the % of the distance as compared to the chosen Bullet number within the group of bullets and the speed of the movement as defined below. If possible, I’d like that option to be present on the chart with a button so that I don’t have to go back to the variables sets and change the value there.
1) Variable: ShowBulletStats YES/NO, Defalult No
If ShowInGroupsof3 = Yes OR ShowInGroupsof4 = Yes
Write distance in % in comparison to bullet # G3-4ReferenceBullet
2) G3-4ReferenceBullet: Bullet1/Bullet2/Bullet3 Default Bullet2
If ShowInGroupsof5 = Yes Show distance in % in comparison to bullet # G5ReferenceBullet
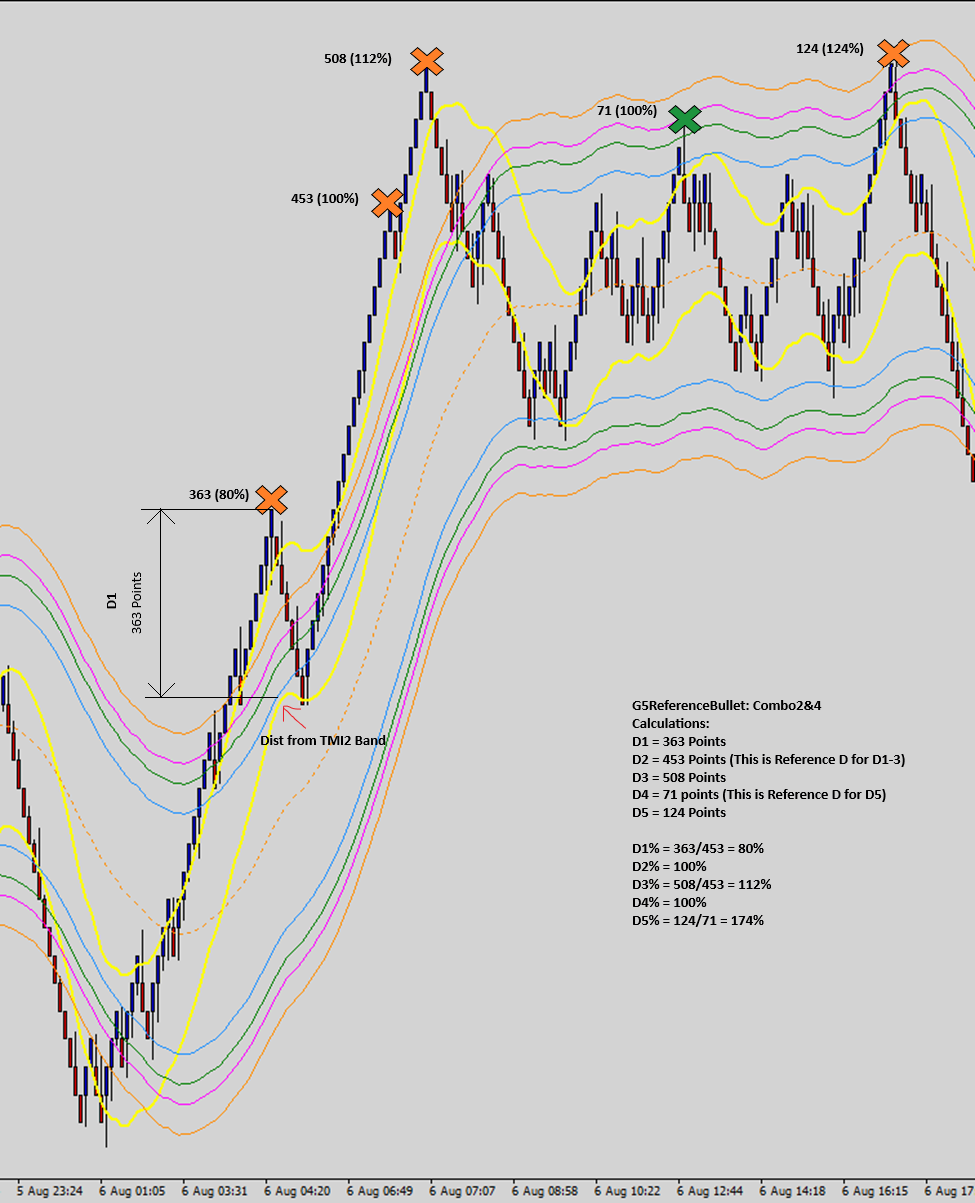
3) G5ReferenceBullet: Bullet1/Bullet2/Bullet3/Bullet4/Combo2+4 Default Combo2+4
When G5ReferenceBullet=Combo2+4, the first 3 bullets distances are written as a percentage of bullet #2 distance and #4 and $3 are written as percentage of Bullet 4 distance. See below example.
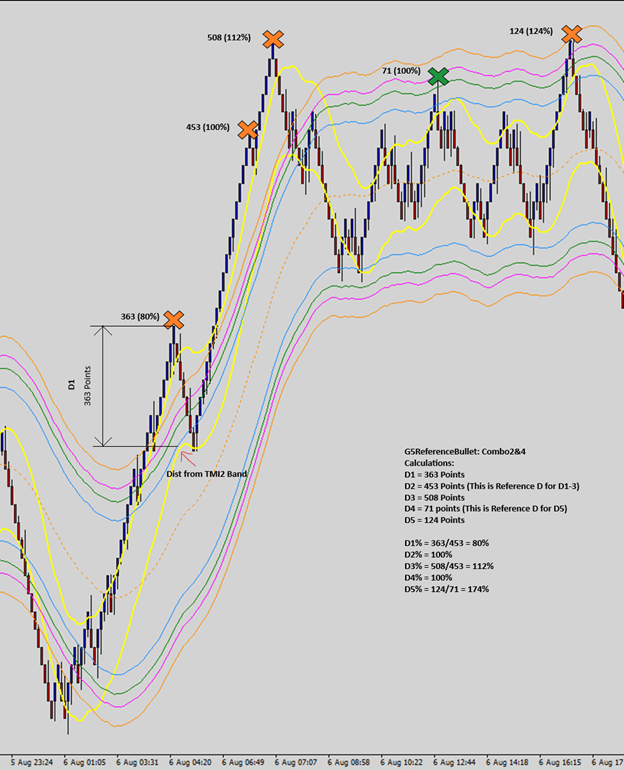
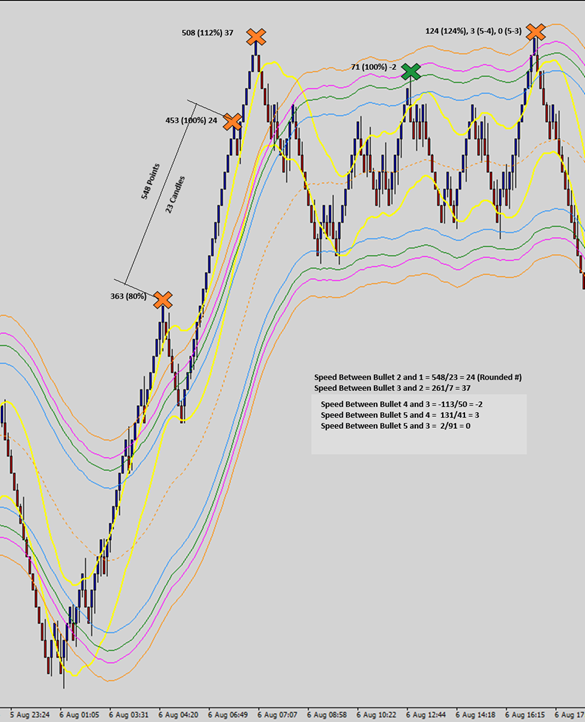
9) Along with the distance above, I’d like to be able to show the speed of the movement between the bullets right after the distance. Speed = Distance divided by number of candles between the two bullets. I’m interested in speed between Bullets 2 and 1, 3 and 2, 4 and 3, 5 and 4 and last 5 and 3
1) ShowSpeed: Yes/No Default Yes See Example:
10) Filters for groups:
1) FilterD3% = Yes/No, Default No, D%Value: real Number, Default 115%
· Only shows groups of 3, 4 or 5 bullets where D3% is >D%Value%
2) FilterD5% = Yes/No, Same D% Value as D%Value is used for filtering
· Only shows groups of 5 bullets where D5% is >D%Value
3) SpeedCutOff : real Number, Default 20
4) Speed(3-2) >SpeedCutOff YES/No, Default No
5) SpeedDecelRatio: Real Number, default 5
6) Speed(4-3)<Speed(3-2) YES/NO Default No (Only when ShowInGroupsof= 4)
7) Speed(3-2)/Speed(4-3)<SpeedDecelRatio Yes/NO Default No (Only when ShowInGroupsof= 4)
8) Speed(5-3)>SpeedCutoff Yes/NO Default No
9) Speed(3-2)/Speed(5-3)<SpeedDecelRatio Yes/NO Default No (Only when ShowInGroupsof= 5)
10) Speed(5-4)>SpeedCutOff YES/NO Default No (Only when ShowInGroupsof= 5)
Filter Distance between Bullet Points:
11) FilterMinBulletDistance YES/NO, Default No
12) MinBulletDistance: Real Number, default 20 points
When FilterMinBulletsDist=YES, D(2-1) and D(3-2) both need to be greater than MinBulletDistance (Please note that D(3-2) is distance between two bullets and not between Bullets and TMI2 line)