Taras Slobodyanik / Profile
- Information
|
9+ years
experience
|
60
products
|
237
demo versions
|
|
629
jobs
|
0
signals
|
0
subscribers
|
Multicurrency and multitimeframe modification of the indicator Bollinger Bands. On the dashboard you can see breakouts and touches of the Bollinger Bands. In the parameters you can specify any desired currencies and timeframes. The indicator can also send notifications when the price touches the Bollinger Bands, when the current volatility changes (expands or falls), and when the price touches all the bands. By clicking on a cell with a period, this symbol and period will be opened. This
1) Added the option "Change the opening of bars". Now you can see the virtual candles.
------------------------------------------------------------
Levels of Timeframes (обновление 2.10)
1) Добавлен параметр "Изменить открытие баров". Теперь вы можете видеть виртуальные свечи.

Symbol Manager or Grid Manager, designed to group orders into one position (by Symbol or by Magic Number). This utility will be useful to multi-currency traders (many EAs), who can have multiple orders on several pairs. You will be able to see the total number of lots, the total profit, and set virtual stop loss and virtual take profit. To set a real TP (or SL), you must first set the virtual value, and then enter the command in this cell: "set". If you want to set real TP/SL for all
1) Separate settings for alerts so that you can disable each separately.
------------------------------------------------------------
Dashboard Stochastic Multicurrency (обновление 2.4)
1) Отдельные настройки для оповещений, чтобы вы могли отключить каждое по отдельности.

1) Added visualization options to hide the Square on the specified periods of the chart.
------------------------------------------------------------
Gann Square of 144 (обновление 2.6)
1) Добавлены параметры отображения, для скрытия Квадрата на заданных периодах чарта.
1) Added cell highlighting if the number of bars in the wave >= X bars.
2) Added alert if the number of bars in the wave >= X bars.
------------------------------------------------------------
1) Добавлена подсветка ячеек если количество баров в волне >=Х баров.
2) Добавлен алерт если количество баров в волне >=Х баров.

1) Changed the alert algorithm when the indicator starts.
When the symbol (period) is switched, there will be no alert, but if a new intersection occurs on the current bar, the alert will appear immediately.
------------------------------------------------------------
Обновление панелей (RSI / CCI / Stochastic)
1) Изменен алгоритм алертов при запуске индикатора.
При переключении символа (периода) не будет алерта, но если произойдет новое пересечение на текущем баре, то алерт появится тут же.
1) Added periods for alerts - "Timeframes for alerts".
2) Added parameter for clearing the chart at startup - "Clear the chart at startup".
3) Added center alignment of the panel - "Centered".
4) Added offsets for the panel - "X offset (pix)" and "Y offset (pix)".
5) Reverse the order of pairs of "Market Watch" without sorting.
------------------------------------------------------------
Dashboard RSI Multicurrency (MT4 & MT5) (обновление 1.8)
1) Добавлены периоды для алертов - "Timeframes for alerts".
2) Добавлен параметр для очистки чарта при старте - "Clear the chart at startup".
3) Добавлено выравнивание панели по центру - "Centered".
4) Добавлены смещения для панели - "X offset (pix)" и "Y offset (pix)".
5) Перевернут порядок пар для "Market Watch" без сортировки.
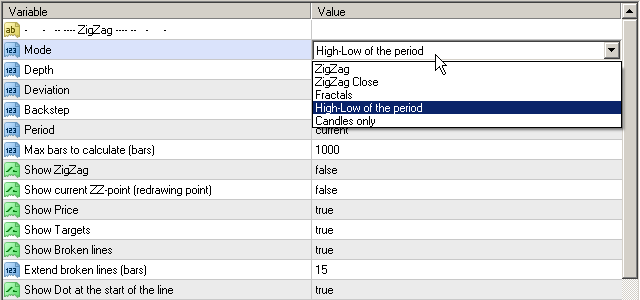
1) Added a new mode "High-Low of the period".
2) Code optimization.
------------------------------------------------------------
ZigZag Lines MTF (MT4 & MT5) (обновление 3.5)
1) Добавлен новый режим "High-Low of the period".
2) Оптимизация кода.

1) Added parameter: "Check Lines crossing only in OB/OS zones".
------------------------------------------------------------
Dashboard Stochastic Multicurrency (обновление 2.0)
1) Добавлен параметр: "Определять пересечение Линий только в зонах Перекупленности/Перепроданности".
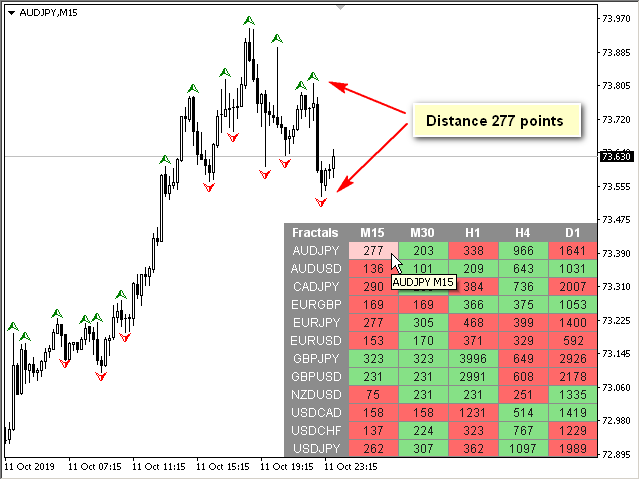
1) Added a new indicator mode: Distance between fractals.
2) Code optimization.
------------------------------------------------------------
Fractals Dashboard (обновление 1.3)
1) Добавлен новый режим индикатора: Дистанция между фракталами.
2) Оптимизация кода.

1) Added the crossing of the Main line and the Signal line (display in the table and alert).
------------------------------------------------------------
Dashboard Stochastic Multicurrency (обновление 1.9)
1) Добавлено пересечение Основной линии и Сигнальной линии (отображение в таблице и алерт).

This is a multicurrency and multitimeframe indicator that calculates the angle between two points. Points for measuring the angle can be taken from the ZigZag (the last two points), or from the Moving Average (between two given bars), or it can be the closing prices of bars. Angle measurement is possible in degrees or in radians. You can select the scale for the calculation. For a better understanding of the indicator, you can study the free Angle High Low indicator. In the parameters you can
This is a multicurrency and multitimeframe indicator that calculates the angle between two points. Points for measuring the angle can be taken from the ZigZag (the last two points), or from the Moving Average (between two given bars), or it can be the closing prices of bars. Angle measurement is possible in degrees or in radians. You can select the scale for the calculation. For a better understanding of the indicator, you can study the free Angle High Low indicator. In the parameters you can
1) Added moving the Square using the WASD keys.
2) Code optimization.
------------------------------------------------------------
Gann Square of 144 (обновление 2.5)
1) Добавлено перемещение Квадрата с помощью клавиш WASD.
2) Оптимизация кода.

1) Added parameter: "Bars to calculate ZZ".
2) Fixed incorrect display for high Depth.
------------------------------------------------------------
ZigZag Dashboard (MT4 & MT5) (обновление 1.4)
1) Добавлен параметр: "Bars to calculate ZZ".
2) Исправлена ошибка неправильного отображения при большом Depth.
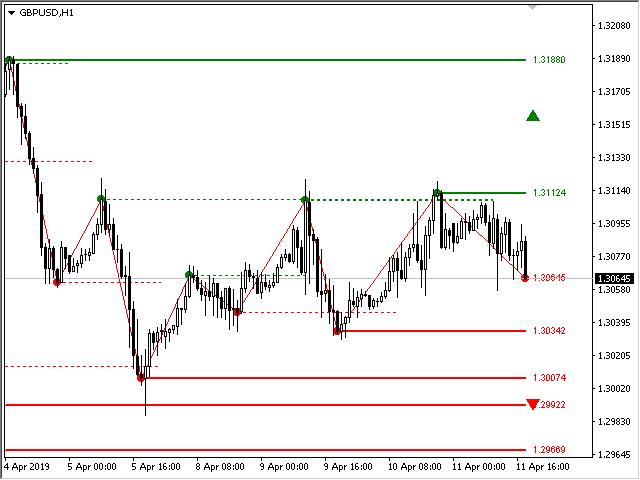
1) Added new mode "ZigZag Close".
2) Added alert when the price is near the line.
------------------------------------------------------------
ZigZag Lines MTF (MT4 & MT5) (обновление 3.4)
1) Добавлен новый режим "ZigZag Close".
2) Добавлен алерт когда цена возле линии.

Multicurrency and multitimeframe modification of the Commodity Channel Index (CCI) indicator. You can specify any desired currencies and timeframes in the parameters. Also, the panel can send notifications when crossing overbought and oversold levels. By clicking on a cell with a period, this symbol and period will be opened. This is MTF Scanner. The key to hide the dashboard from the chart is "D" by default. Parameters CCI Period — averaging period. CCI Applied price
Multicurrency and multitimeframe modification of the Commodity Channel Index (CCI) indicator. You can specify any desired currencies and timeframes in the parameters. Also, the panel can send notifications when crossing overbought and oversold levels. By clicking on a cell with a period, this symbol and period will be opened. This is MTF Scanner. The key to hide the dashboard from the chart is "D" by default. Parameters CCI Period — averaging period. CCI Applied price — price
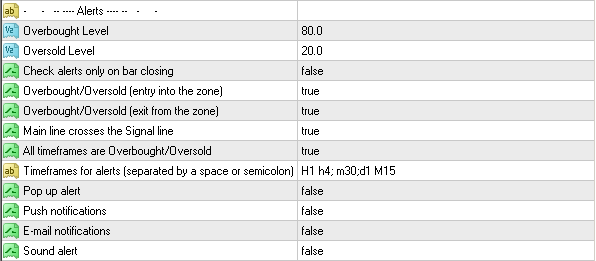
1) Added an alert to exit the overbought / oversold zone.
2) Added parameter: "Check alerts only on bar closing".
------------------------------------------------------------
Dashboard RSI Multicurrency (MT4 & MT5) (обновление 1.7)
1) Добавлен алерт выхода из зоны перекупленности/перепроданности.
2) Добавлен параметр: "Check alerts only on bar closing".


