sathish kumar / Profile
HAI, I AM TRADER. I HOPE YOU ALL DOING WELL.
I USE FIBONACCI RETRACEMENT, SUPPORT AND RESISTANCE
I USE FIBONACCI RETRACEMENT, SUPPORT AND RESISTANCE
Friends
547
Requests
Outgoing
sathish kumar
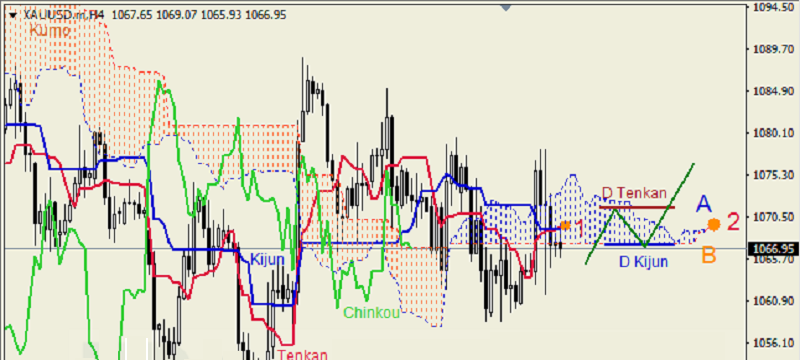

XAU USD, “Gold vs US Dollar” XAU USD, Time Frame H4. Indicator signals: Tenkan-Sen and Kijun-Sen ran into one another inside Kumo Cloud (1). Chinkou Lagging Span is below the chart; Ichimoku Cloud is closed (2...
sathish kumar


RoboOption is announcing a pre-holiday week with special trading conditions! Every day (except for Saturday and Sunday) from December 16th to 23rd 2015, you have the opportunity to trade on your RoboOption accounts and receive incredibly high payouts for some particular assets of "Binary" type...
sathish kumar
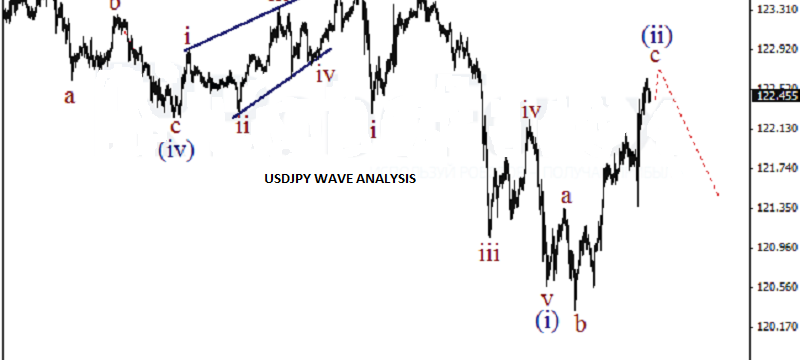

USD JPY, “US Dollar vs Japanese Yen” At H1 chart. It looks like after completing the wave v of (i), the market is being corrected in the wave (ii), which is taking the form of the flat. The price may finish the impulse in the wave c of (ii...
Share on social networks · 2
156
sathish kumar
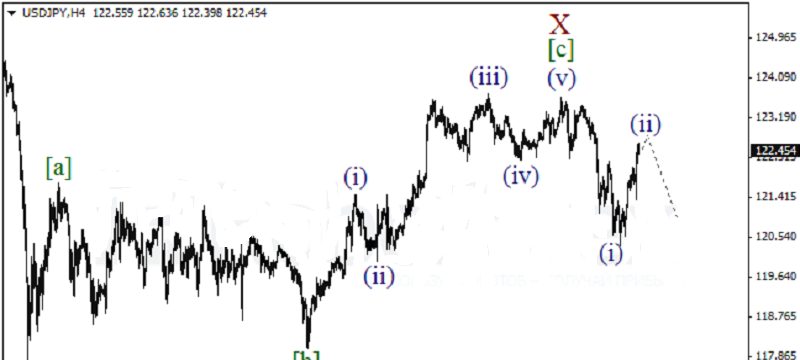

USD JPY, “US Dollar vs Japanese Yen” At the H4 chart, Yen has finished the descending impulse in the wave (i). At the moment, the pair is being corrected in the wave (ii). in the nearest future, the market may start falling in the wave (iii...
Share on social networks · 2
150
sathish kumar
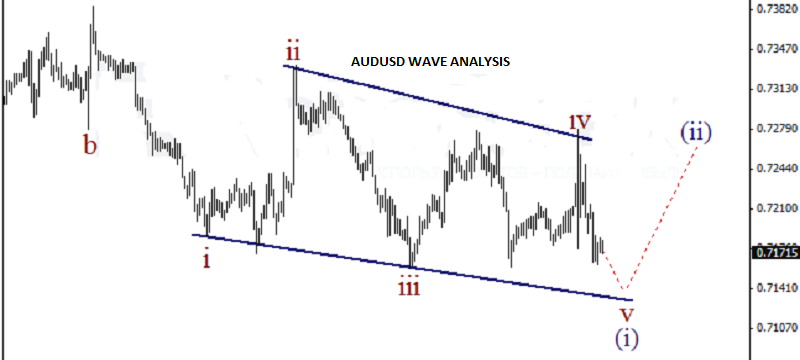

AUD USD, “Australian Dollar vs US Dollar” At the H1 chart, the market is finishing the wave v of (i). Probably, in the nearest future the price may rebound from the lower border of the wedge. Consequently, on Wednesday the pair may start the ascending correction in the (ii...
Share on social networks · 1
153
sathish kumar
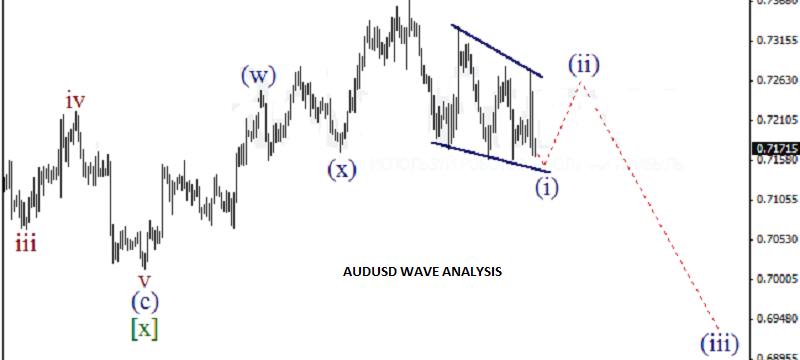

AUD USD, “Australian Dollar vs US Dollar” Australian Dollar is finishing the descending wedge in the wave (i). If the price rebounds from the pattern’s lower border, it may start a new correction...
sathish kumar
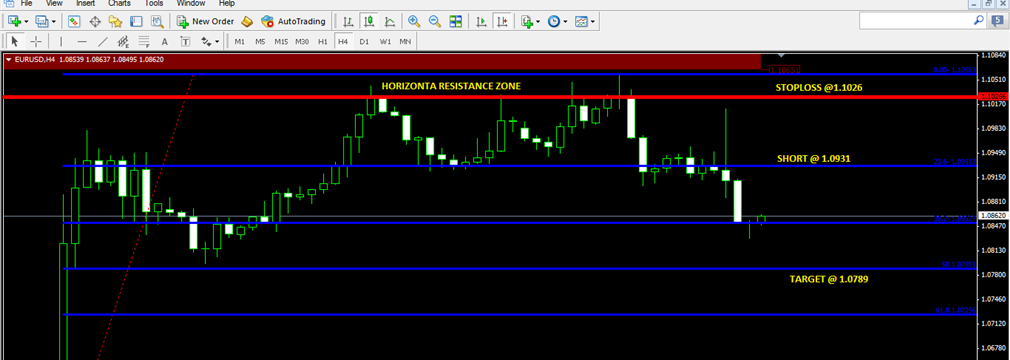

EURUSD 4HOUR CHART SHORT ENTRY @ 1.0931 (FIBO 23.6 LEVEL) TARGET @ 1.0789(FIBO 50 LEVEL) STOPLOSS @ 1.1026(HORIZONTAL RESISTANCE...
sathish kumar
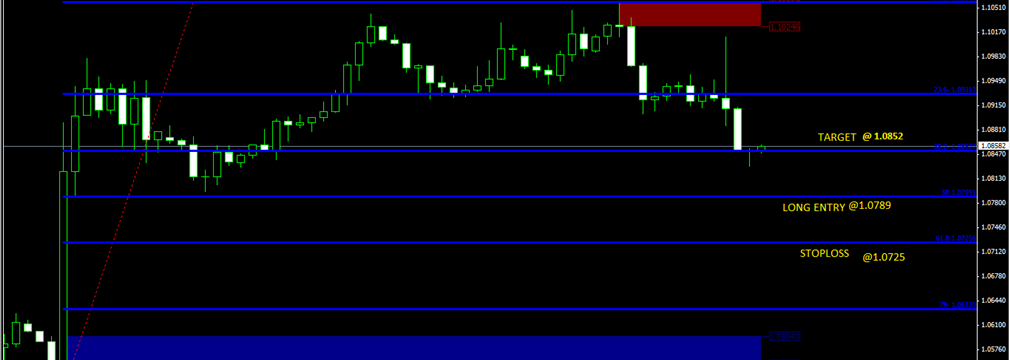

EURUSD 4HOUR CHART LONG ENTRY 1.0789 (FIBO 50LEVEL) TARGET 1.0852(FIBO 38.2 LEVEL) STOP LOSS 1.0725(FIBO 61.8 LEVEL...
sathish kumar
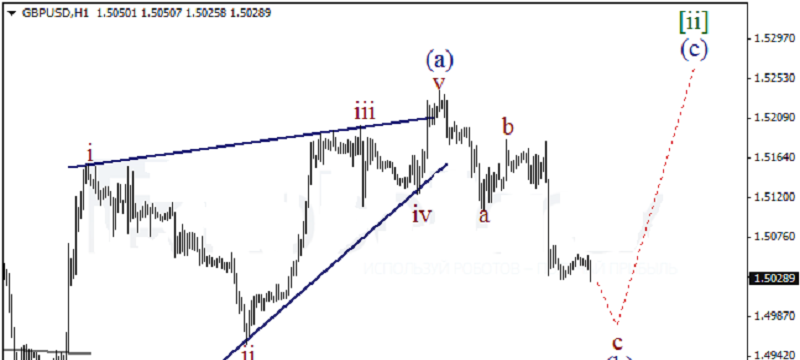

GBP USD, “Great Britain Pound vs US Dollar” Gbpusd has formed the wedge in the wave (a). After completing the wave b, the price has started falling in the wave c of (b), Will move to (c)[ii]...
Share on social networks · 1
172
sathish kumar
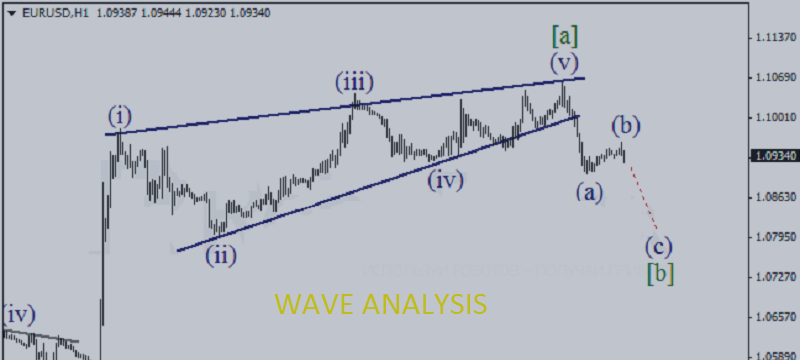

EUR USD, “Euro vs US Dollar” The price finished the fifth wave and then the descending impulse in the wave (a) along with the local correction. The price may fall in the bearish wave (c) of [b]...
Share on social networks · 1
241
sathish kumar
Published post Economic events for 17.12.2015
Forex economic events 17.12.2015 00:00Central Bank Reserves $ Currency: RUB, Importance: Low...
sathish kumar
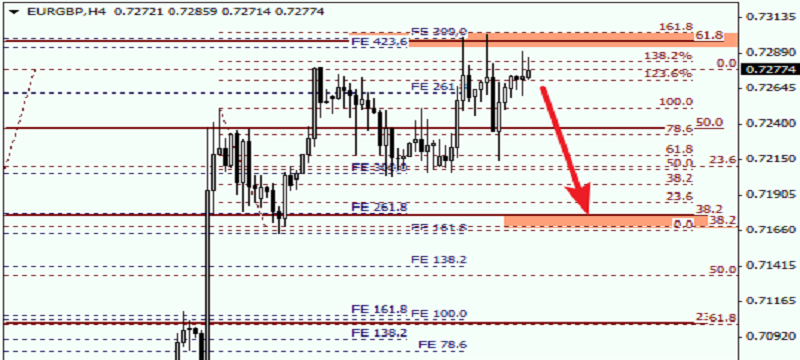

EUR GBP, “Euro vs Great Britain Pound” Europound is trying to rebound from the group of upper fibo-levels and resume its movement inside the current downtrend. The pair may fall to reach local retracements at 0.7170...
Share on social networks · 1
171
sathish kumar
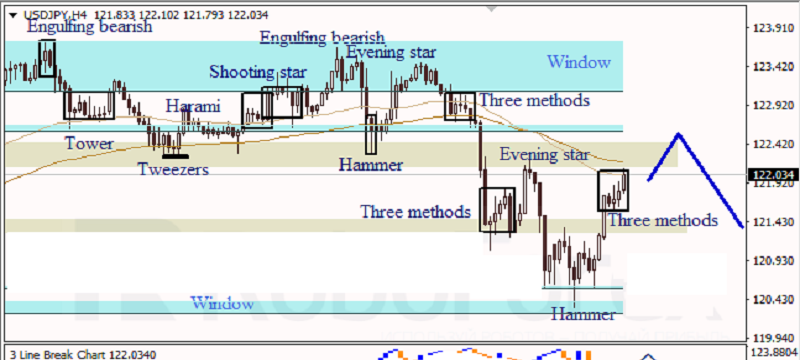

USD JPY, “US Dollar vs. Japanese Yen” At the H4 chart of USD JPY, Hammer and Three Methods patterns show an ascending movement. The downside Window provided support. Three Line Break chart and Heiken Ashi candlesticks confirm a bullish direction...
sathish kumar
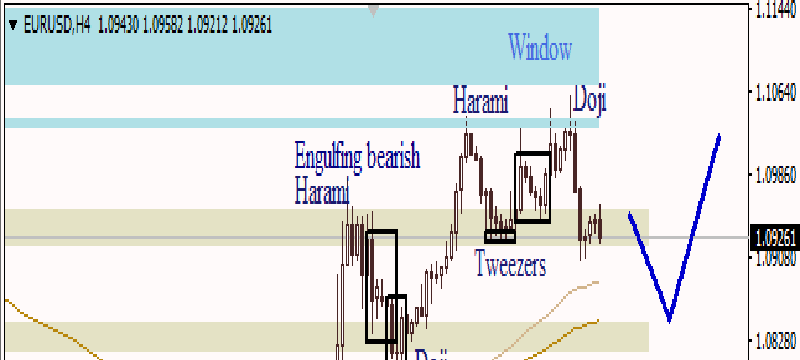

EUR USD, “Euro vs. US Dollar” At the H4 chart of EUR USD, the closest Window provided resistance once again. Doji pattern indicated a descending movement. Three Line Break chart and Heiken Ashi candlesticks confirm a bearish direction...
sathish kumar
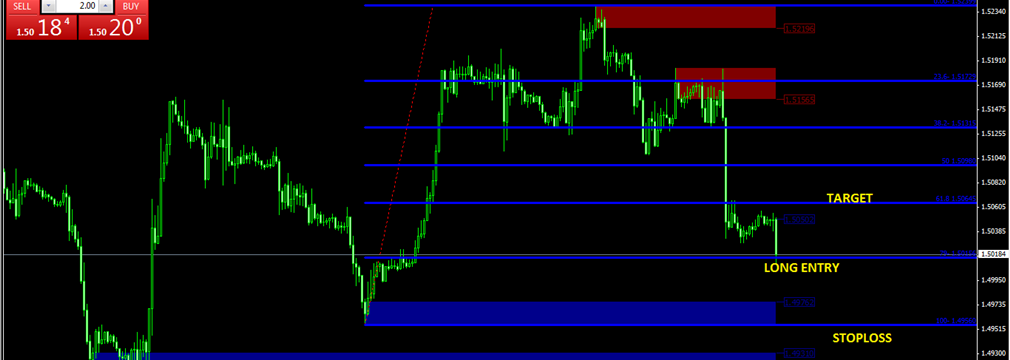


GBPUSD 1HOUR CHART:LONG TRADE SETUP LONG @ 1.5015 (FIBO LEVEL 79) TARGET 1.5064 (FIBO LEVEL 61.8) STOPLOSS 1.4956...
sathish kumar
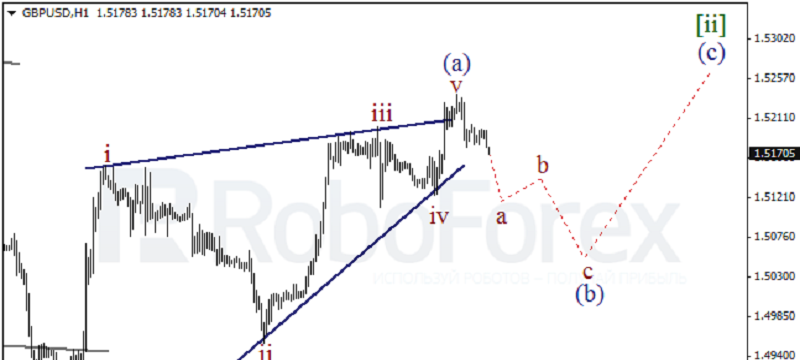

GBP USD, “Great Britain Pound vs US Dollar” At the H1 chart, Pound has formed the ascending wedge in the wave (a). It’s highly likely that the price has started falling in the wave a of (b...
Share on social networks · 2
245
1
sathish kumar
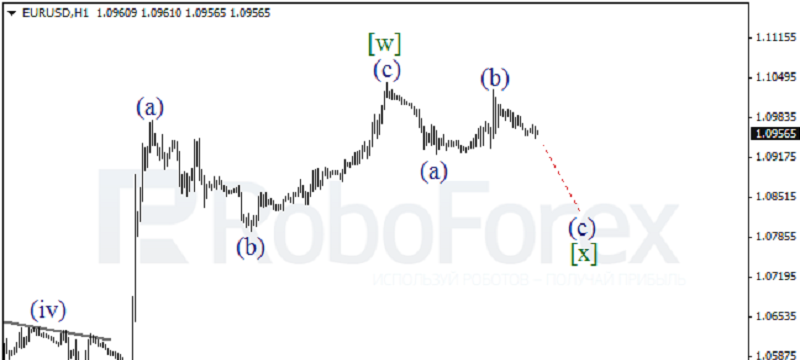

EUR USD, “Euro vs US Dollar” After finishing the zigzag in the wave [w], the pair has started a new correction. The price continue falling in the wave (c) of [x]...
Share on social networks · 1
188
sathish kumar
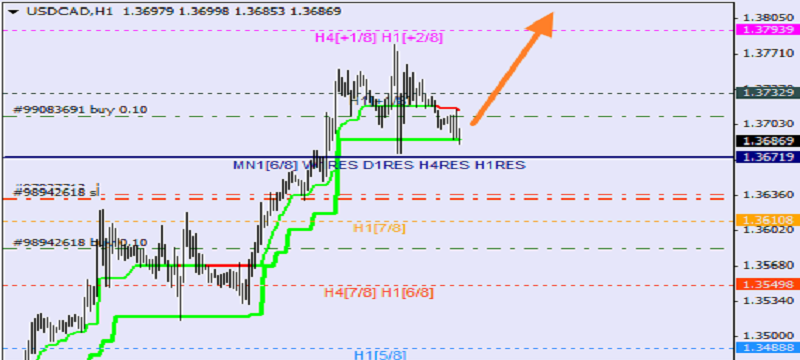

USD CAD, “US Dollar vs Canadian Dollar” At the H1 chart, the price is also moving at the top; Super Trends provide support. During the day, the pair may resume growing and break the +2/8 level. In this case, the lines at the chart will be redrawn...
Share on social networks · 1
336
:

