Flash Boys : Michael Lewis Flash Boys is about a small group of Wall Street guys who figure out that the U.S. stock market has been rigged for the benefit of insiders and that, post–financial crisis
Swing and Day Trading: Evolution of a Trader Comprehensive coverage of the four major trading styles Evolution of a Trader explores the four trading styles that people use when learning to trade or
Во время азиатской сессии опять наблюдается понижение фьючерсов на нефть. Так, на Нью-Йоркской товарной бирже фьючерсы на нефть WTI с поставкой в августе торгуются на уровне $102,82 за баррель. Сырая нефть, скорее всего, найдет поддержку на уровне $101,55 и сопротивление на $104,20...
Trading the News: Canada Net Change in Employment Canada Employment to Increase Another 20.0K in June , Jobless Rate to Hold at an Annualized 7.0% for Second-Month Another 20.0K rise in Canada
Would Google have been as successful if it had stuck with the name BackRub? Choosing a name for a new business is perhaps the first big decision that the founder has to make. How vital is it to pick a
Hedge Fund Market Wizards: How Winning Traders Win Fascinating insights into the hedge fund traders who consistently outperform the markets, in their own words From bestselling author, investment
When Genius Failed: The Rise and Fall of Long-Term Capital Management On September 23, 1998, the boardroom of the New York Fed was a tense place. Around the table sat the heads of every major Wall
Bayesian Methods for Hackers: Probabilistic Programming and Bayesian Methods The Bayesian method is the natural approach to inference, yet it is hidden from readers behind chapters of slow
В четверг выросли фьючерсы на золото во время азиатской сессии на товарной бирже Comex. Так, фьючерсы на золото с поставкой в августе торговались на уровне $1.330,30 за тройскую унцию...
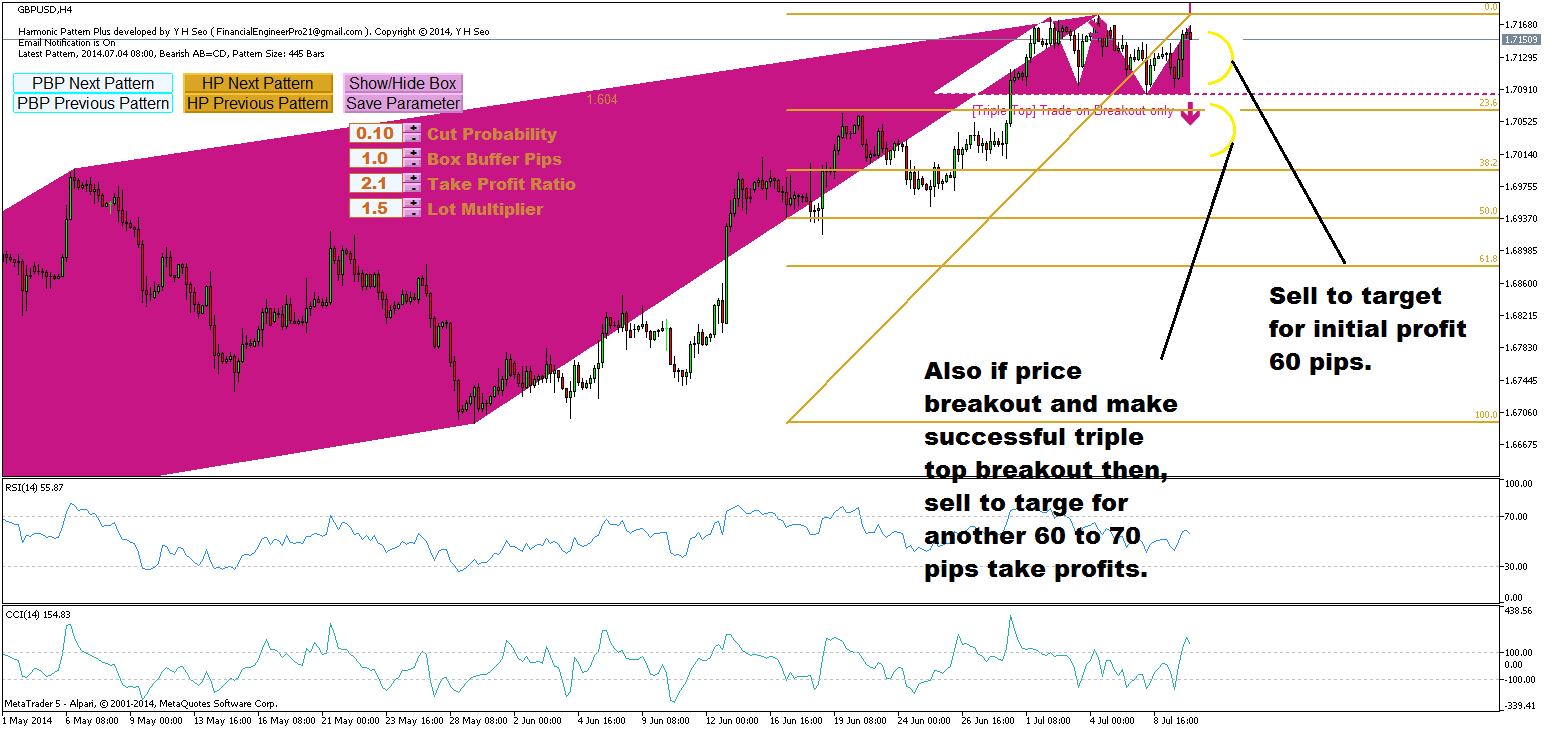
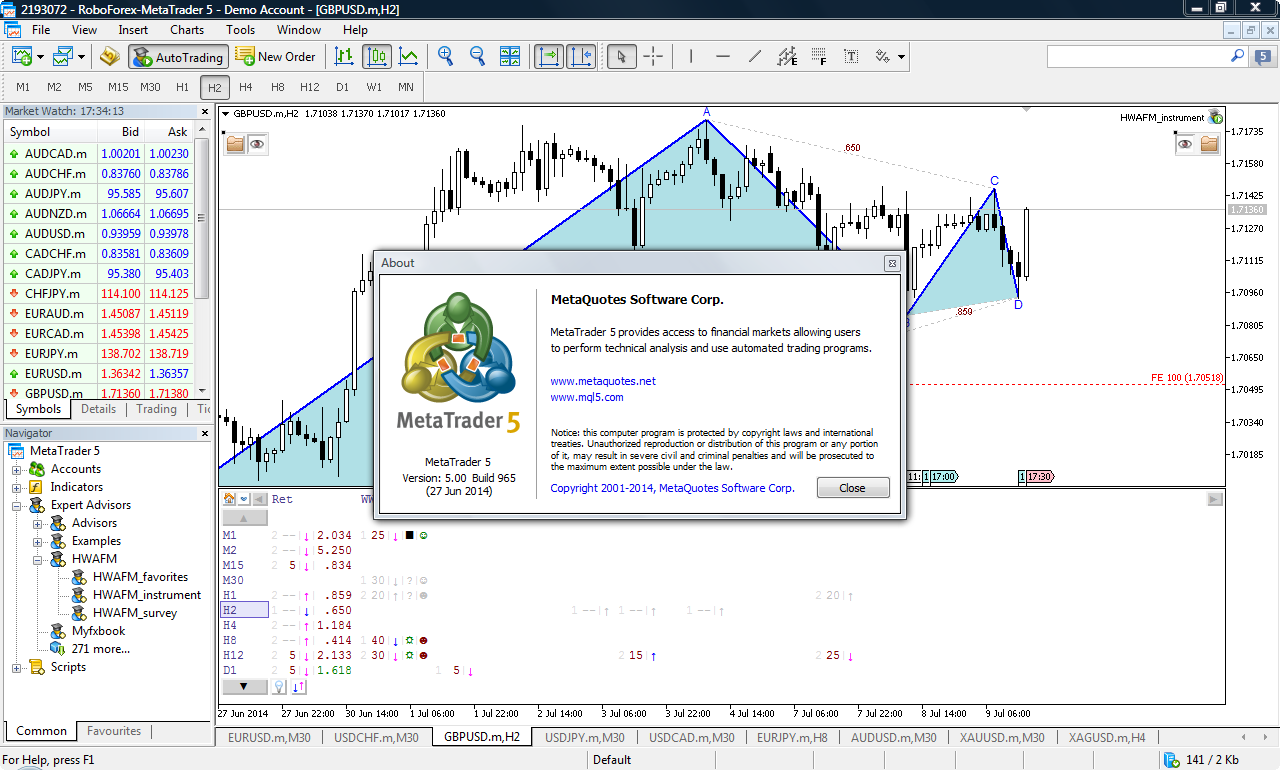
Good news is that now GBPUSD shows more clearer view than before. Bearish ABCD pattern formed since 4 July is still there and effective. In addition, my breakout pattern scanner detected a bearish triple top patterns on H4 time frame. I am now seeing more opportunity from sell market. As I shown in my Pic, there is two sell operation you might conduct. First one from top of triple top pattern to double bottom aiming initial take profits of 60 pips. Second, if price breakout below the double bottom, then we could aim another 60 to 70 pips near the 38.6% retracement level of the bearish ABCD pattern.
Today, we have couple of important GBPUSD data to be released including possible MPC rate statement. So use this analysis with together.