mazen nafee / Profile
- Information
|
11+ years
experience
|
0
products
|
0
demo versions
|
|
0
jobs
|
0
signals
|
0
subscribers
|
Friends
944
Requests
Outgoing
mazen nafee

Icham Aidibe
Backtesting & reliability
Hi, Just reporting a fact : the results of an EA i've backtested on a period are different from a day to another for the same period. Did i miss something ? ADD : it made my optimized settings obsolete the day after, i'm disappointed :/
mazen nafee

Icham Aidibe
EA, Real account, backtesting
Hi, Before using an EA on a real account , should it be reliable in 1 month backtesting, a year backtesting or all history chart backtesting ? Thanks
mazen nafee

Icham Aidibe
Total Current Profit
Hi, I know how to get the profit of a position on the current symbol the EA is running on. But how to get the total profit for all the position opened by the EA ? Thanks. EDIT : Is there anyway to get notification only for answers received on the
mazen nafee

Icham Aidibe
SymbolInfoDouble/SymbolInfoInteger
Date= "+SymbolInfoInteger(_Symbol,SYMBOL_TIME)+" returns the date in that format : Date=1392399002 did i miss something
mazen nafee

Icham Aidibe
SendMail syntax
Hi i'm trying to use strings & variables inside SendMail() ... : SendMail ( "Notify : Close opened position" , "Closed at : Ask=" + SYMBOL_ASK + ", Bid=" + SYMBOL_BID + ", Date=" + SYMBOL_TIME + " Symbol=" + Symbol ()+ " Period=" + Period () "
mazen nafee

Icham Aidibe
Awesome Oscillator & Copybuffer the color
Hello, I'm looking for a way to CopyBuffer() the color change from the AO oscillator. I can get the value, but not the color. I didn't find any docs on this buffer, i watch the indicator source, it seems that it's the n°1, but yet can't get it to
mazen nafee

Icham Aidibe
Debugging a MT4 MTF ichimoku converted to MT5
Hello there, As I am a newbie in mql coding ... is there anyone to help debugging this code from 31 errors ? It's a public & free indicator & have to stay free for MT5 so ... just avoid the "post in the jobs" ;) #property copyright
mazen nafee

Sergey Golubev
Comment to topic Press review
Key Fundamental Releases this Week (7/28-8/1) Last week the USD strengthened in anticipation of this week’s FOMC meeting. The market has replaced concerns that stemmed from poor Q1 GDP with
mazen nafee

Sergey Golubev
Comment to topic Press review
Trading Video: Risk Trends and Rate Expectations Amid FOMC, NFPs, GDP The coming week looks to be one dominated by rate speculation, but risk trends are coiled like a spring, US event risk including
mazen nafee

Sergey Golubev
Comment to topic Press review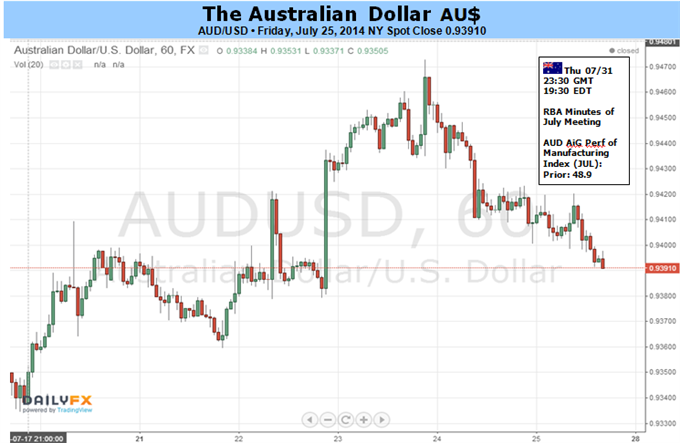
AUDUSD Fundamentals (based on dailyfx article ) Fundamental Forecast for Australian Dollar : Neutral AUD Set For Another Flat Finish Despite Plenty Of Intraday Volatility, Light Economic Docket May Do

mazen nafee

Sergey Golubev
Comment to topic Press review
Forex Weekly Outlook Jul 28-Aug 1 US Housing data, ADP Non-Farm Employment Change, GDP figures in the US and Canada, US rate decision and Non-Farm Payrolls are the main market movers this week. Here
mazen nafee
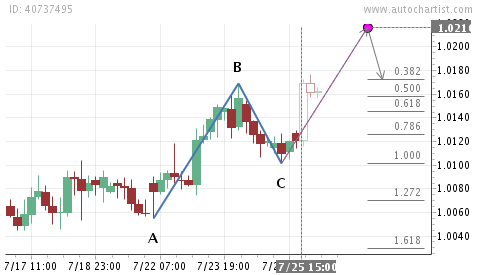
Symbol AUDCAD
Interval 240 Min
Pattern ABCD
Identified Time 07-25 15:00
Length 30 Candles
Time Symmetry
Time symmetry will increase when any Fibonacci ratios found on the time axis are similar to the Fibonacci ratios on the price axis.
Price Symmetry
There is a small margin of difference allowed between actual price ratios and the Fibonacci ratios. Price symmetry illustrates how close the actual price ratios are to the Fibonacci ratios.
Clarity
The level of "noise" in the price graph - more spiky price movements mean a lower clarity score
Target 0.382
1.0172
Target 0.500
1.0158
Target 0.618
1.0145
Target 0.786
1.0126
Target 1.000
1.0101
Target 1.272
1.0070
Target 1.618
1.0030

mazen nafee
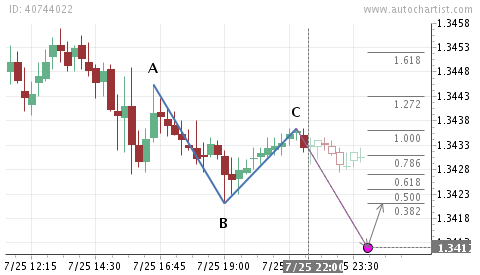
Pattern ABCD
Length 30 Candles
Target 0.382
1.3421
Target 0.500
1.3424
Target 0.618
1.3427
Target 0.786
1.3431
Target 1.000
1.3436
Target 1.272
1.3443
Target 1.618
1.3452
Length 30 Candles
Target 0.382
1.3421
Target 0.500
1.3424
Target 0.618
1.3427
Target 0.786
1.3431
Target 1.000
1.3436
Target 1.272
1.3443
Target 1.618
1.3452

mazen nafee
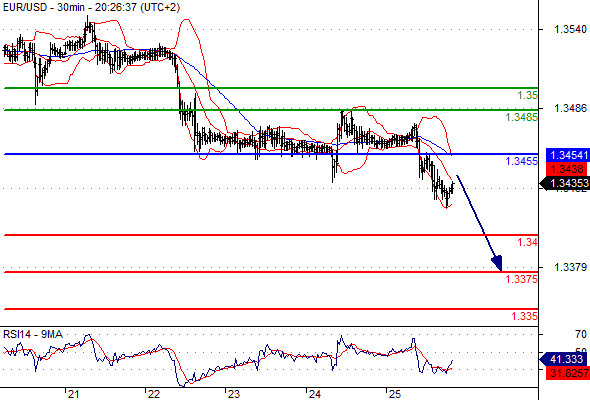
Pivot: 1.3455
Our preference: Short positions below 1.3455 with targets @ 1.34 & 1.3375 in extension.
Alternative scenario: Above 1.3455 look for further upside with 1.3485 & 1.35 as targets.
Comment: Technically the RSI is below its neutrality area at 50.
Supports and resistances:
1.35
1.3485
1.3455
1.3433 Last
1.34
1.3375
1.335

mazen nafee
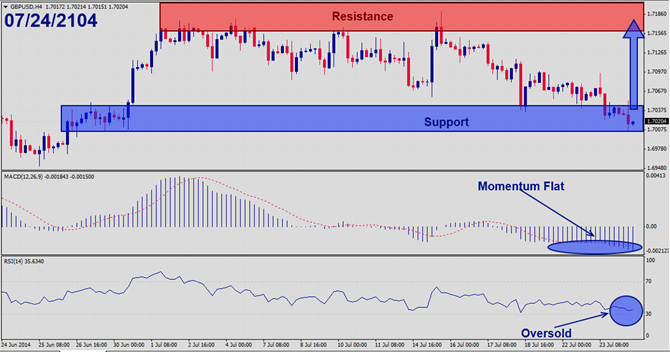
Should price action for the GBPUSD remain inside the 1.7020 to 1.7050 zone the following trade set-up is recommended:
Timeframe: H4
Recommendation: Long Position
Entry Level: Long Position @ 1.7030
Take Profit Zone: 1.7130 – 1.7150
Stop Loss Level: 1.6980
Should price action for the GBPUSD breakout above 1.7050 the following trade set-up is recommended:
Timeframe: H4
Recommendation: Long Position
Entry Level: Long Position @ Retracements in the trend; buy orders during dips
Take Profit Zone: 1.7130 – 1.7150
Stop Loss Level: 1.6980
Should price action for the GBPUSD breakdown below 1.7020 the following trade set-up is recommended:
Timeframe: H4
Recommendation: Short Position
Entry Level: Short Position @ 1.7010
Take Profit Zone: 1.6880 – 1.6910
Stop Loss Level: 1.7060
Timeframe: H4
Recommendation: Long Position
Entry Level: Long Position @ 1.7030
Take Profit Zone: 1.7130 – 1.7150
Stop Loss Level: 1.6980
Should price action for the GBPUSD breakout above 1.7050 the following trade set-up is recommended:
Timeframe: H4
Recommendation: Long Position
Entry Level: Long Position @ Retracements in the trend; buy orders during dips
Take Profit Zone: 1.7130 – 1.7150
Stop Loss Level: 1.6980
Should price action for the GBPUSD breakdown below 1.7020 the following trade set-up is recommended:
Timeframe: H4
Recommendation: Short Position
Entry Level: Short Position @ 1.7010
Take Profit Zone: 1.6880 – 1.6910
Stop Loss Level: 1.7060
mazen nafee
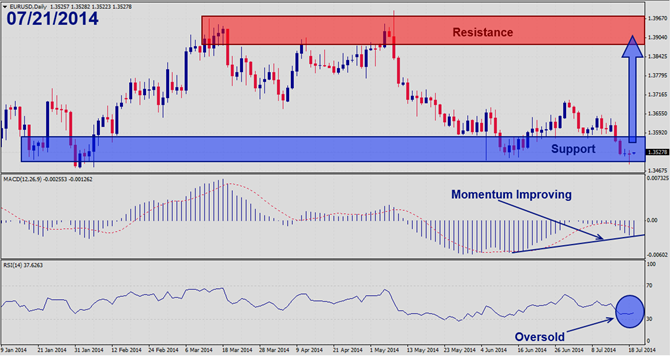
Should price action for the EURUSD remain inside the 1.3500 to 1.3540 zone the following trade set-up is recommended:
Timeframe: D1
Recommendation: Long Position
Entry Level: Long Position @ 1.3520
Take Profit Zone: 1.3930 – 1.3970
Stop Loss Level: 1.3330
Should price action for the EURUSD breakout above 1.3540 the following trade set-up is recommended:
Timeframe: D1
Recommendation: Long Position
Entry Level: Long Position @ Retracements in the trend; buy orders during dips
Take Profit Zone: 1.3930 – 1.3970
Stop Loss Level: 1.3330
Should price action for the EURUSD breakdown below 1.3500 the following trade set-up is recommended:
Timeframe: D1
Recommendation: Short Position
Entry Level: Short Position @ 1.3490
Take Profit Zone: 1.3380 – 1.3400
Stop Loss Level: 1.3540
Timeframe: D1
Recommendation: Long Position
Entry Level: Long Position @ 1.3520
Take Profit Zone: 1.3930 – 1.3970
Stop Loss Level: 1.3330
Should price action for the EURUSD breakout above 1.3540 the following trade set-up is recommended:
Timeframe: D1
Recommendation: Long Position
Entry Level: Long Position @ Retracements in the trend; buy orders during dips
Take Profit Zone: 1.3930 – 1.3970
Stop Loss Level: 1.3330
Should price action for the EURUSD breakdown below 1.3500 the following trade set-up is recommended:
Timeframe: D1
Recommendation: Short Position
Entry Level: Short Position @ 1.3490
Take Profit Zone: 1.3380 – 1.3400
Stop Loss Level: 1.3540
mazen nafee
Added topic AUDJPY Technical Analysis 2014
AUD JPY Weekly Chart SELL Entry Month Resistance at 96.476 With Pattern Bearish Dragon
Share on social networks · 2
1
mazen nafee

AUD CHF H1 Chart SELL Entry Day Resistance at 0.85289 With Pattern
Bearish max Butterfly
With Divergence on ADX
Bearish max Butterfly
With Divergence on ADX

:
