Leonardo Sposina / Seller
Published products
This is a trend indicator based on a strategy created by William Dunnigan that emit signals to buy or sell on any timeframe and can assist in decision making for trading on stock market or Forex. The signals are fired according to the following rules: Buy Signal = Fired at the first candlestick in which close price is higher than the higher price of the last candlestick. The higher and lower prices of the current candlestick must be higher than the corresponding ones of the last candlestick as w
This utility tool draws the ticker symbol and timeframe information as a watermark in the background of the chart. It may come in handy if you have multiple charts on the screen at the same time. Inputs: Font Name: You can change text font by typing in the name of your favorite font installed on your operating system. (e.g.: Verdana, Palatino Linotype, Roboto, etc...) Font Color: You can choose your favorite from the available colors or type in a custom RGB color (values from 0 to 255, e.g.:
This indicator measures the largest distance between a price (high or low) and a moving average. It also shows the average distance above and below the moving average. It may come in handy for strategies that open reverse positions as price moves away from a moving average within a certain range, awaiting it to return so the position can be closed. It just works on any symbol and timeframe. Parameters: Moving average period : Period for moving average calculation. Moving average method : You can
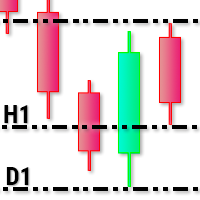
This utility tool draws timeframes top/bottom horizontal named lines on the chart, which highlight important regions and can assist in decision making for trading. Inputs: Timeframes Top/Bottom Lines: H1 (1 hour), H4 (4 hours), D1 (Daily), W1 (Weekly), MN1 (Monthly): You can choose to enable or disable timeframes top/bottom named lines. Lines Color: You can choose your favorite from the available colors or type in a custom RGB color (values from 0 to 255, e.g.: 100, 128, 255). Lines Style: You c
This utility tool shows the intraday price variation as a percentage. It just works on any symbol and timeframe. Inputs: Font Size: You can change the font size of the price variation. Defaults to 15. Corner Location: You can choose between "Left upper chart corner", "Left lower chart corner", "Right upper chart corner", "Right lower chart corner" to show the information.