• Overview
  • Reviews (22)
  • Comments (79)
  • What's new

Market Reversal Alerts MT5

4.8

Profit from market structure changes as price reverses and pulls back.

The market structure reversal alert indicator identifies when a trend or price move is approaching exhaustion and ready to reverse. It alerts you to changes in market structure which typically occur when a reversal or major pullback are about to happen.

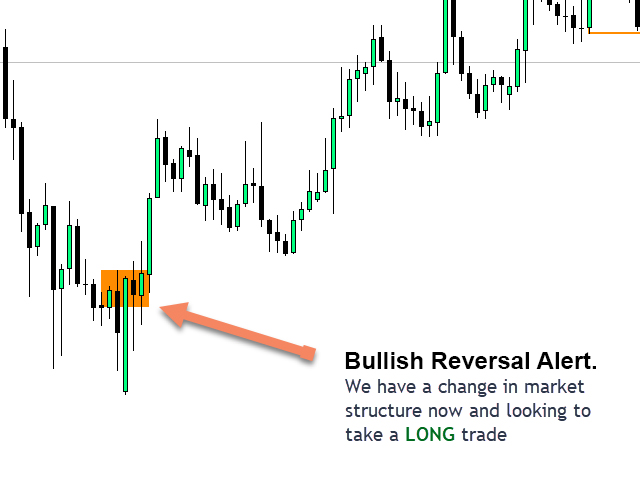
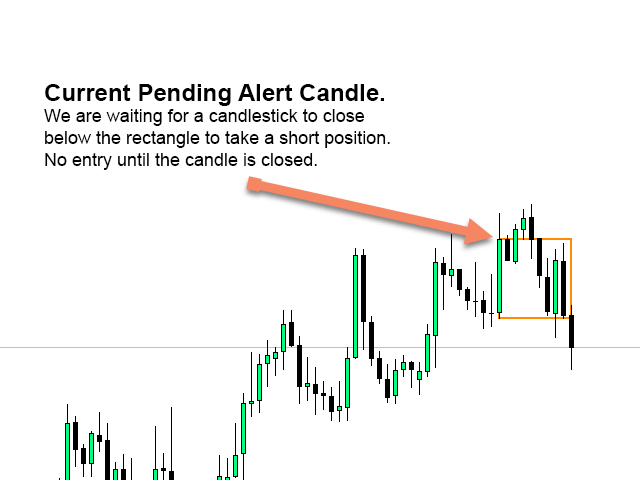
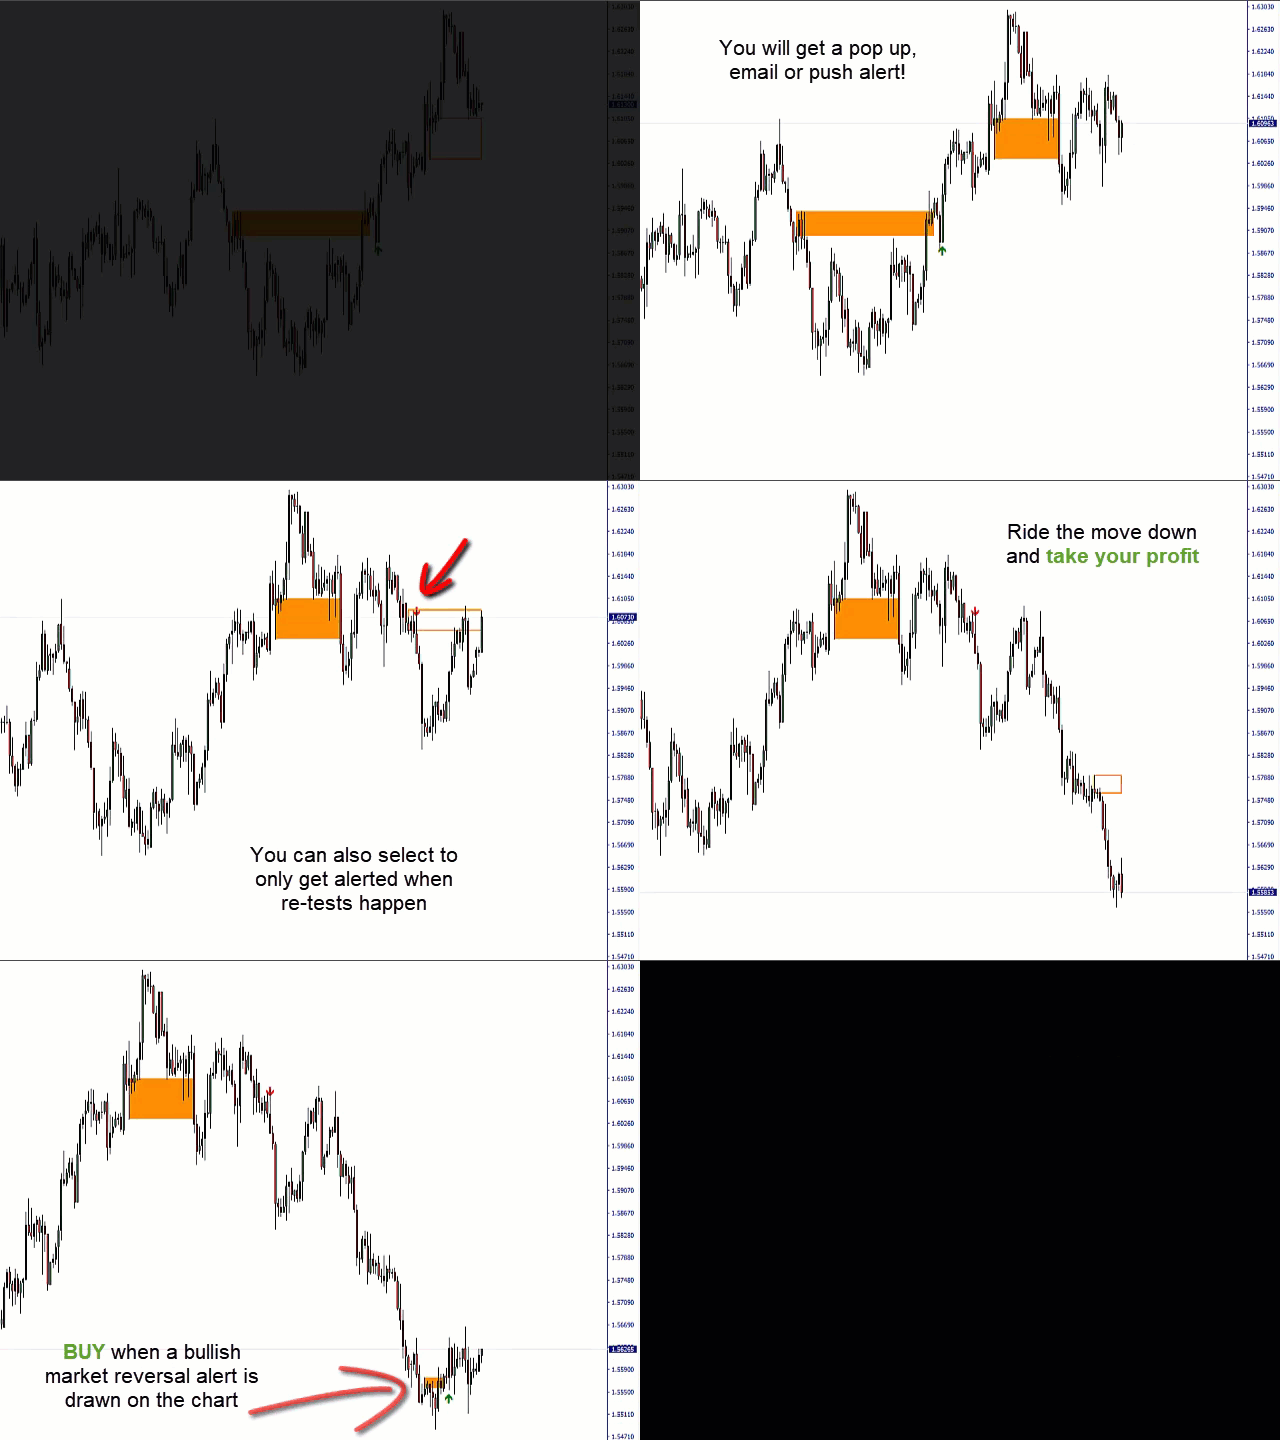
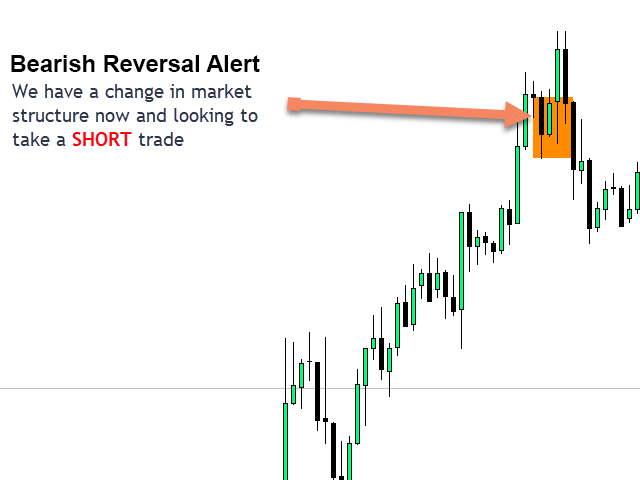
The indicator identifies breakouts and price momentum initially, every time a new high or low is formed near a possible exhaustion point. The indicator draws in a rectangle on the last opposite coloured candle. It will then trail the rectangle along with price as it continues to move in it's current short term trend. Once price weakens enough that it closes back above or below the rectangle this would indicate a potential shift in market structure is taking place. The indicator then alerts you to a potential shift in direction and the start of a possible reversal in trend or major pullback.

See the indicator in action below to see how it works!

Dashboard to monitor all pairs and major timeframes available here: https://www.mql5.com/en/market/product/65828

MT4 Version Available Here: https://www.mql5.com/en/market/product/46295/

Features

  • Alerts you to potential changes in market structure at key exhaustion points
  • Automatically draws in short term market structure as price approaches exhaustion levels
  • Trails the alert rectangles behind price as it moves in it's current trend direction to find the tightest entries
  • Changes colour to a solid block rectangle on alerts to show where potential reversals in market structure have occurred
  • Works on all symbols and timeframes
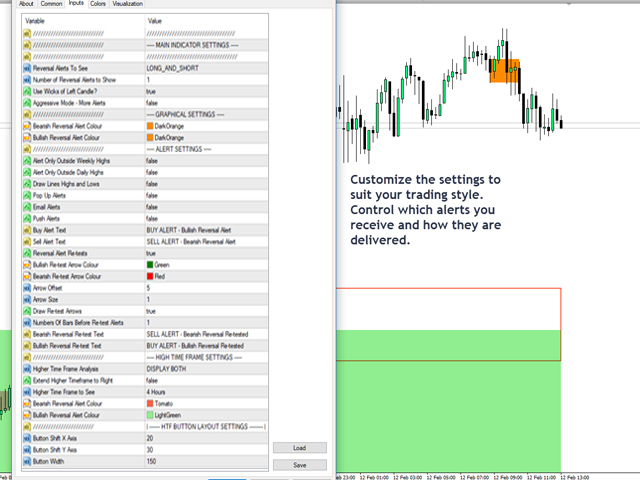
  • Integrated pop-up, push and email alerts built in
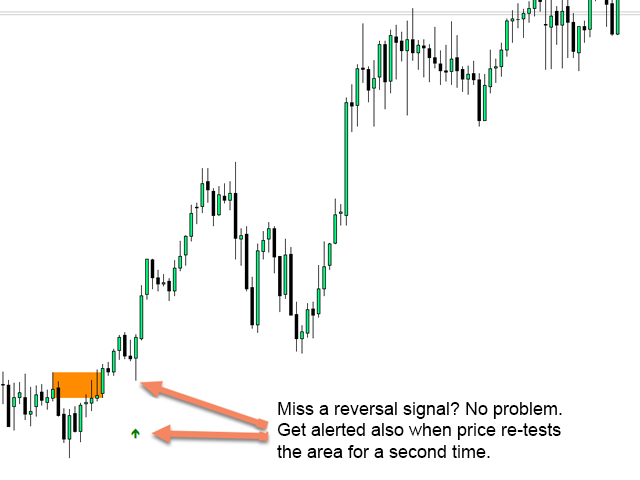
  • Alerts when a re-test of a reversal alert has happened confirming the entry as being more likely
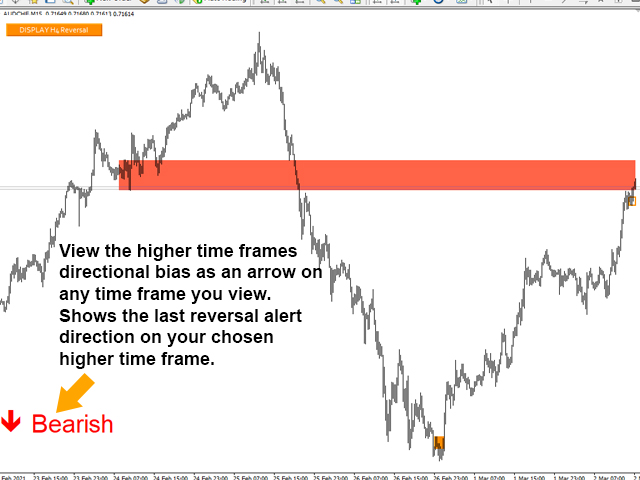
  • Allows you to view higher time frame reversal rectangles on your lower trading time frame. Great for trend traders and identifying higher time frame trend direction
  • Select all reversal alerts or just long or short alerts, select the directional alerts you want based on each pairs current trend direction
  • View higher time frame directional bias arrow on your lower time frame chart.

Strategy & How To Trade With The Market Structure Reversal Indicator

When a reversal alert occurs:

  1. Look left! Is there a supply/demand or support/resistance level that we're turning at. Market structure shifts (reversals) usually occur when price is retesting an old level or a stop hunt has just happened above that support or resistance level.
  2. Consult a higher time frame to see if there is an area of support/resistance we are turning at. As above changes in market structure will often happen on lower time frames when at major levels on a higher time frame.

If the above conditions are met simply place a trade in the direction of the reversal. 

You can add additional indicators as validation or use this indicator to add further validation to your existing indicators or strategy!

Stop Loss and Take Profit

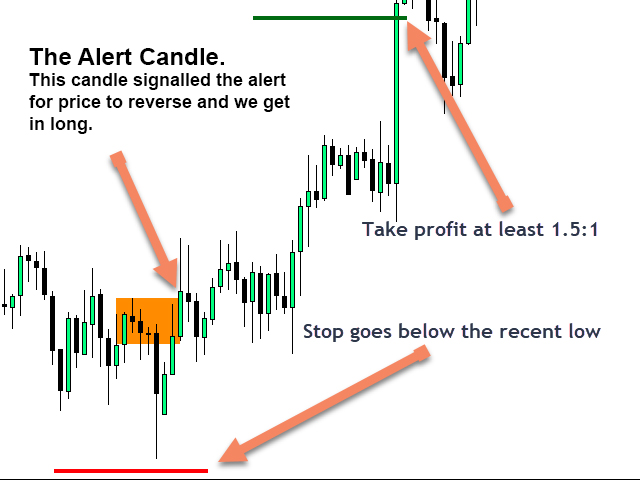
Your stop should always go just above the most recent high or below the most recent low. If the reversal is correctly identifying a shift in market structure price will rarely move back above/below the most recent peak. The size of your stop will be dependent on how aggressive the last move to create the recent high was.

Take profit is up to the individual but using a 1.5:1 or 2:1 risk to reward is easily achievable. Entering 2 trades and having one trail along with price just above/below new rectangles as they are drawn on the chart can achieve 5:1 and higher risk reward.

Download the free demo to use in the strategy tester and see how it works.
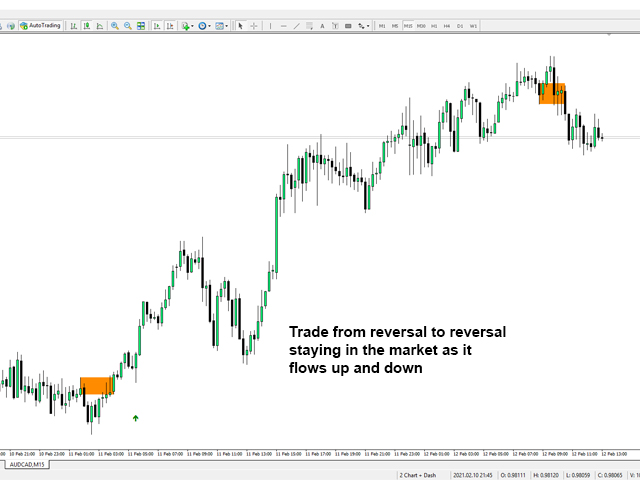
See how big some of the moves are after the reversal alerts trigger!

Reviews 20
Manuel Gonzalez
97
Manuel Gonzalez 2023.11.02 21:51 
 

This has been with complete honesty, my story and my personal experience with the indicator. I bought the indicator 1 year ago and I really hadn't set it up well because I didn't take the time to watch and listen carefully to the setup videos and strategy videos. I knew that the indicator was very good, and that it was my fault. 2 days ago I took the time to watch and listen to the instruction videos with great attention and detail; I configured the indicator properly (I use it in M15 and I can see in said timeframe what is happening in H4... Incredible!!) Therefore, since yesterday everything has changed in a very positive way. They are just gains and profits (I use it on Deriv synthetic indices on MT5 and it works excellent on all assets, whether Boom, Crash (In bullish and bearish trend) it also works excellent on volatility indices. Thank you very much Lee for having a more than excellent product. This is my opinion based on my personal experience, since I am NOT a professional trader (Thursday, November 2, 2023 - 15:49 p.m.)

built2nv
44
built2nv 2023.07.19 02:53 
 

Great Indicator works as described, if you are a seasoned trader and have your indicators that you previously used before the purchase or this indicator and you was profitable, the with this as an add on you should see even more profits flooding in with ease.....adjust your setting within the indicator and the rest will be history.

Scott Smith
72
Scott Smith 2023.07.18 17:14 
 

very impressed with this indicator - when i add this to my current strategy it makes is x10 better, very exciting for the future, highly recommended

Recommended products
The indicator builds current quotes, which can be compared with historical ones and on this basis make a price movement forecast. The indicator has a text field for quick navigation to the desired date. Options: Symbol - selection of the symbol that the indicator will display; SymbolPeriod - selection of the period from which the indicator will take data; IndicatorColor - indicator color; Inverse - true reverses quotes, false - original view; Next are the settings of the te
55 USD
Do you use volume in your reading of the market? Certainly many traders use it, and do not imagine operating without it. The Color Histogram Volume Set indicator allows the user to choose the value that he considers interesting to monitor. When you pass this you will have visual confirmation and if you want you will also have the audible alert that is given by the indicator. Of course, there are other ways to try to find a high volume, such as assessing whether the volume
30 USD
Provided Trend is a complex signal formation indicator. As a result of the work of internal algorithms, you can see only three types of signals on your chart. The first is a buy signal, the second is a sell signal, and the third is a market exit signal. Options: CalcFlatSlow - The first parameter that controls the main function of splitting the price chart into waves. CalcFlatFast - The second parameter that controls the main function of splitting the price chart into waves. CalcFlatAvg - Par
100 USD
HMA Trend Professional MT5
Pavel Zamoshnikov
4.4 (5)
Improved version of the free HMA Trend indicator (for MetaTrader 4) with statistical analysis. HMA Trend is a trend indicator based on the Hull Moving Average (HMA) with two periods. HMA with a slow period identifies the trend, while HMA with a fast period determines the short-term movements and signals in the trend direction. The main differences from the free version: Ability to predict the probability of a trend reversal using analysis of history data. Plotting statistical charts for analyz
30 USD
Noize Absorption Index - is the manual trading system that measures the difference of pressure between bears forces and bulls forces. Green line - is a noize free index that showing curent situation. Zero value of index shows totally choppy/flat market.Values above zero level shows how powerfull bullish wave is and values below zero measures bearish forces.Up arrow appears on bearish market when it's ready to reverse, dn arrow appears on weak bullish market, as a result of reverse expectation.
199 USD
Your Trend Friend
Luigi Nunes Labigalini
The trend is your friend! Look at the color of the indicator and trade on that direction. It does not  repaint. After each candle is closed, that's the color of the trend. You can focus on shorter faster trends or major trends, just test what's most suitable for the symbol and timeframe you trade. Simply change the "Length" parameter and the indicator will automatically adapt. You can also change the color, thickness and style of the lines. Download and give it a try! There are big movements
99 USD
Gioteen Volatility Index (GVI) - your ultimate solution to overcoming market unpredictability and maximizing trading opportunities. This revolutionary indicator helps you in lowering your losing trades due to choppy market movements. The GVI is designed to measure market volatility, providing you with valuable insights to identify the most favorable trading prospects. Its intuitive interface consists of a dynamic red line representing the volatility index, accompanied by blue line that indicate
100 USD
Was: $249  Now: $99   Market Profile defines a number of day types that can help the trader to determine market behaviour. A key feature is the Value Area, representing the range of price action where 70% of trading took place. Understanding the Value Area can give traders valuable insight into market direction and establish the higher odds trade. It is an excellent addition to any system you may be using. Blahtech Limited presents their Market Profile indicator for the MetaTrader community. Ins
99 USD
PZ Trend Trading MT5
PZ TRADING SLU
3.67 (3)
Trend Trading is an indicator designed to profit as much as possible from trends taking place in the market, by timing pullbacks and breakouts. It finds trading opportunities by analyzing what the price is doing during established trends. [ Installation Guide | Update Guide | Troubleshooting | FAQ | All Products ] Trade financial markets with confidence and efficiency Profit from established trends without getting whipsawed Recognize profitable pullbacks, breakouts and early reversals The ind
249 USD
This indicator will show you the TP and SL Values (in that currency) that you already set  for every orders on the charts  ( closed to the transaction/order line)  that will help you a lot to estimated your profit and loss for every order.    And it also show you the PIPs values too.  the shown format  is      " Currency Values of our Profit or Loss /  PIPs values ".    The TP Value will be shown in Green Color and  the SL Value  will be shown in Red Color.  For any question or more information,
99 USD
Premium level is a unique indicator with more than 80% accuracy of correct predictions! This indicator has been tested for more than two months by the best Trading Specialists! The author's indicator you will not find anywhere else! From the screenshots you can see for yourself the accuracy of this tool! 1 is great for trading binary options with an expiration time of 1 candle. 2 works on all currency pairs, stocks, commodities, cryptocurrencies Instructions: As soon as the red ar
1 100 USD
Be notified of every color change of Heiken Ashi (HA) candles. The indicator will trigger past and new signals every time that HA candles change their colors. ( Note : this tool is based on the code of Heiken Ashi indicator developed by MetaQuotes Software Corp.) Features The signals are triggered at closing of last bar/opening of a new bar; Any kind of alerts can be enabled: Dialog Box, Email message, SMS notifications for smartphones and tablets, and Sound alerts; By default, up arrows are p
35 USD
A "Volume Profile" is an advanced charting indicator that displays total volume traded at every price level over a user specified time period. The main components of the volume profile are POC ( Point Of Control - the price level, at which the maximum number of contracts were executed during a selected period), VAH ( Value Area High - the highest price in the Value Area) and VAL ( Value Area Low - the lowest price in the Value Area). When we settled on the original indicator, we spent a lot o
150 USD
Blahtech Supply Demand MT5
Blahtech Limited
4.57 (14)
Was: $299  Now: $99   Supply Demand uses previous price action to identify potential imbalances between buyers and sellers. The key is to identify the better odds zones, not just the untouched ones. Blahtech Supply Demand indicator delivers functionality previously unavailable on any trading platform. This 4-in-1 indicator not only highlights the higher probability zones using a multi-criteria strength engine, but also combines it with multi-timeframe trend analysis, previously confirmed swings
99 USD
Volume by Price MT5
Brian Collard
5 (2)
The Volume by Price Indicator for MetaTrader 5 features Volume Profile and Market Profile TPO (Time Price Opportunity). Get valuable insights out of currencies, equities and commodities data. Gain an edge trading financial markets. Volume and TPO histogram bar and line charts. Volume Footprint charts. TPO letter and block marker charts including split structures. Positioning and styling options to suit the user's needs and context. Highlight Volume Profile and Market Profile TPO Point of Contro
259 USD
This indicator is the same as the popular Heiken Ashi Smoothed. The Heikin Ashi indicator for MetaTrader 5 already exists, but it has two disadvantages: It paints the candles not accurate. It's not possible to change the candle width. See also Heikin Ashi in MQL5 Code Base . In this version there are no such disadvantages.
30 USD
Value Chart Candlesticks
Flavio Javier Jarabeck
4.83 (6)
The idea of a Value Chart indicator was presented in the very good book I read back in 2020 , " Dynamic Trading Indicators: Winning with Value Charts and Price Action Profile ", from the authors Mark Helweg and David Stendahl. The idea is simple and the result is pure genius: Present candlestick Price analysis in a detrended way! HOW TO READ THIS INDICATOR Look for Overbought and Oversold levels. Of course, you will need to test the settings a lot to find the "correct" one for your approach.
FREE
The Copier MT5
Andrey Barinov
4.69 (13)
This is a professional trades copier with easy to use interface and fast rock solid execution. It has some unique functionality which is missing in other trades copiers (see details below). It can copy trades between both MT4 and MT5 terminals in any combinations. Supports "One to Many" and "Many to One" copying modes. Version for MetaTrader4 is available here: https://www.mql5.com/en/market/product/15853 Functionality Copying between any terminals . MT4 => MT5 MT4 => MT4 MT5 => MT4 MT5 =>
49 USD
GoldTrader
Yashar Seyyedin
Please backtest with the exact balance of your live account before applying to real money. ==> If account balance is too low it may not trade at all! For MT4 version please contact via private message. martingale version is available here . Strategy description - Detect trend based on EMA18-EMA50-SMA200 alignment in three time frames: M15, H1, H4 - Trade in trend direction and exit when above alignment is broken. - The bot is tuned to trade XAUUSD(Gold). - The bot output is break even in rangi
FREE
How to use Pair Trading Station Pair Trading Station is recommended for H1 time frame and you can use it for any currency pairs. To generate buy and sell signal, follow few steps below to apply Pair Trading Station to your MetaTrader terminal. When you load Pair Trading Station on your chart, Pair Trading station will assess available historical data in your MetaTrader platforms for each currency pair. On your chart, the amount of historical data available will be displayed for each currency pai
280 USD
No Demand No Supply MT5
Trade The Volume Waves Single Member P.C.
No Demand No Supply   This indicator identifies   No Demand –No Supply candles  to your chart and plots volume bars colored according to the signal. It can be applied to all timeframes or to a specific one only. It can also be used as regular volume indicator  with exceptional future of WEIGHTED VOLUME. Furthermore is has an alert notification, sound and email when a signals occurs. The indicator does not repaint but the alert will come on two candles back due to the definition of No Demand No S
80 USD
True Day
Aurthur Musendame
5 (1)
True Days is a tool designed specifically for the trader who wants to catch intraday volatility in price charts.  True day makes it easier for the trader to avoid trading in the dead zone - a period in time where markets are considered dead or non volatile. The trader can concentrate on finding opportunities only during periods of profound market movements. By default the indicator gives you a true day starting at 02:00 to 19:00 hours GMT+2. You can adjust according to your Time Zone. By deafult
FREE
Hello There, Today I want to show you my new researchable fore BUY SELL indicator, it work all asset, and also work Derive Volatility asset! it work all time frame, but i recommend start 5 minute to H1 when you receive a signal just take trade and stay wait for your take profit asset All Major Pair And minor IT WORK ALSO XAUUSD Fantastic results,  for more info,,, message us thank you   
500 USD
This innovative indicator for measuring the strength of currencies from INFINITY is an indispensable assistant for scalpers and traders trading for a long time. The system for analyzing the Strength / weakness of currencies has long been known and used in the market by the world's leading traders. Any arbitrage trading is not complete without this analysis. Our indicator easily determines the strength of the base currencies in relation to each other. It displays line charts for all or the curre
49 USD
Best SAR MT5
Ashkan Hazegh Nikrou
5 (1)
Description :  we are happy to introduce our new free indicator based on one of professional and popular indicators in forex market (Parabolic SAR) this indicator is new modification on original Parabolic SAR indicator, in pro SAR indicator you can see cross over between dots and price chart, this crossover is not signal but talk about end of movement potential, you can start buy by new blue dot, and place stop loss one atr before first blue dot, and finally you can exit as soon as dots cross
FREE
MT5 indicators. Three levels of Fibonacci support and resistance levels are automatically drawn. They are: Month Level: Medium Orchid Weekly level: Orange Red Dayline level: Turquoise Color can be adjusted by parameters. This indicator is mainly used to analyze future support and resistance levels for better trade analysis. If the support level is effectively supported for many times, the market will break through the previous high point, and the effective trend breakout will be lon
40 USD
This indicator has been developed to identify and display these trends quickly and easily, allowing you to see instantly, those currency pairs which are trending, and those which are not – and in all timeframes, with just one click. The 28 currency pairs are displayed as a fan as they sweep from strong to weak and back again, and this is why we call it the ‘currency array’. All 28 pairs are arrayed before you, giving an instant visual description of those pairs that are trending strongly, those
197 USD
Trade history
Andriy Konovalov
5 (3)
The indicator plots charts of profit taken at the Close of candles for closed (or partially closed) long and short positions individually. The indicator allows to filter deals by the current symbol, specified expert ID (magic number) and the presence (absence) of a substring in a deal comment, to set the start time and the periodicity of profit reset (daily, weekly or monthly) to calculate the profit chart. The indicator also displays the floating (not fixed) profit of the opened positions at th
30 USD
SmartTrendMt5
Andrey Spiridonov
The SmartTrendMt5 trend indicator generates signals based on the principle of combined analysis of calculated reference points within the Keltner channel. The indicator plots the Keltner channel in a separate window (by default, red lines and a blue line - the middle of the channel), and also draws the histogram of calculated reference points for each candle (by default, the histogram bars are yellow). The should be attached to a chart of any timeframe and any trading symbol in the usual way.
450 USD
A visualization system for favorite candlesticks price action patterns. Once attached, indicator will automatically mark next patterns on the chart: Pinocchio bar  - a small-body bar with a long 'nose', very well-known reverse pattern; Inside bar  - a bar whose range lies inside the range of the previous bar. It represents market incertitude; Outside bar  - a bar whose range exceeds the range of the previous bar. It represents market incertitude; Rails pattern  - two consequent opposite bars wit
30 USD
Buyers of this product also purchase
Description: First of all Its worth emphasizing here that this Trading System is Non-Repainting, Non-Redrawing and Non-Lagging Indicator, Which makes it ideal from both manual and robot trading.  For limited time only 50% OFF,  Now 100$ only. 4 purchases left & the price increases to 200$ Contact me right after the purchase to share with you the user manual. The “Smart Trend Trading System MT5” is a comprehensive trading solution tailored for new and experienced traders. It combines over 10 pre
100 USD
How many times have you bought a trading indicator with great back-tests, live account performance proof with fantastic numbers and stats all over the place but after using it, you end up blowing your account? You shouldn't trust a signal by itself, you need to know why it appeared in the first place, and that's what RelicusRoad Pro does best! NOW $147 (increasing to $499 after a few updates) - UNLIMITED ACCOUNTS (PCs or MACs) **  User Manual + Strategies + Training Videos + Private Group with
147 USD
Top indicator for MT5   providing accurate signals to enter a trade without repainting! Watch  the video  (6:22) with an example of processing only one signal that paid off the indicator! Exclusive: Indicator price slashed for just 3 days! Real price is 225 USD! It can be applied to any financial assets: forex, cryptocurrencies, metals, stocks, indices .  MT4 version is here It will provide pretty accurate trading signals and tell you when it's best to open a trade and close it. Most traders i
99 USD
FX Volume MT5
Daniel Stein
4.93 (14)
Get your daily market update with details and screenshots via our Morning Briefing  here on mql5  and  on Telegram ! FX Volume is the FIRST and ONLY volume indicator that provides a REAL insight into the market sentiment from a broker's point of view. It provides awesome insights into how institutional market participants, like brokers, are positioned in the Forex market, much faster than COT reports. Seeing this information directly on your chart is the real game-changer and breakthrough solu
249 USD
Owl Smart Levels MT5
Sergey Ermolov
4.42 (33)
MT4 version  |  How to install?   |   FAQ The Owl Smart Levels Indicator is a complete trading system within the one indicator that includes such popular market analysis tools as Bill Williams' advanced fractals , Valable ZigZag which builds the correct wave structure of the market, and Fibonacci levels which mark the exact levels of entry into the market and places to take profits. Detailed description of the strategy Instructions for working with the indicator Advisor-assistant in trading Owl
97 USD
Trend Screener Pro MT5
STE S.S.COMPANY
4.88 (52)
Unlock the Power of  Trends trading with Trend Screener Indicator: Your Ultimate Trend Trading Solution powered by fuzzy logic and Multi-currencies System ! Elevate your trend trading with Trend Screener, the revolutionary trend indicator powered by   fuzzy logic.  It is a powerful trend-following indicator that combines over  13 premium tools and features and 3 trading strategies  , making it a versatile choice to   make your Metatrader a Trend Analyzer. LIMITED TIME OFFER : Trend Screener Indi
50 USD
Gold Stuff mt5
Vasiliy Strukov
4.9 (137)
Gold Stuff mt5 is a trend indicator designed specifically for gold and can also be used on any financial instrument. The indicator does not redraw and does not lag. Recommended time frame H1. Contact me immediately after the purchase to get   personal bonus! Settings  and manual   here   SETTINGS Draw Arrow - on off. drawing arrows on the chart. Alerts -   on off audible alerts. E-mail notification - on off. email notifications. Puch-notification - on off. Push notifications. Next, adjust the co
149 USD
FX Power MT5 NG
Daniel Stein
5 (2)
Trading GOLD, and currencies, with the dog walk strategy  - super smart Trading GOLD, and currencies, with the breakout strategy  - super easy Get your daily market update with details and screenshots via our Morning Briefing  here on mql5  and  on Telegram ! FX Power MT5 NG  is the next generation of our long-time very popular currency strength meter, FX Power.  And what does this next-generation strength meter offer? Everything you have loved about the original FX Power  PLUS GOLD/XAU s
169 USD
ICT, SMC, SMART MONEY CONCEPTS, SMART MONEY, Smart Money Concept, Support and Resistance, Trend Analysis, Price Action, Market Structure, Order Blocks, BOS/CHoCH,   Breaker Blocks ,  Momentum Shift,   Supply&Demand Zone/Order Blocks , Strong Imbalance,   HH/LL/HL/LH,    Fair Value Gap, FVG,  Premium  &   Discount   Zones, Fibonacci Retracement, OTE, Buy Side Liquidity, Sell Side Liquidity, BSL/SSL Taken, Equal Highs & Lows, MTF Dashboard, Multiple Time Frame, BigBar, HTF OB, HTF Market Structur
65 USD
Strong Support mt5
Vasiliy Strukov
5 (9)
Support and resistance levels have long been a powerful tool for market analysis. The Strong Support indicator plots support levels based on local price minima, and resistance levels based on local price maxima. My other developments can be viewed   here It is recommended to use together with a trend indicator, for example, Gold Stuff - this will allow you to trade according to the trend and simultaneously determine the zones of consolidation or trend reversal, as well as set stop loss and
149 USD
IX Power   finally brings the unbeatable precision of FX Power to non-Forex symbols. It accurately determines the intensity of short, medium and long-term trends in your favourite indices, stocks, commodities, ETFs, and even cryptocurrencies. You can   analyse everything   your terminal has to offer. Try it out and experience how   your timing improves significantly   when trading. IX Power Key Features 100% precise non-repainting calculation results - for all trading symbols available in
99 USD
Quantum Heiken Ashi PRO MT5
Bogdan Ion Puscasu
5 (3)
Introducing the Quantum Heiken Ashi PRO charts with integrated alerts Designed to provide clear insights into market trends, the Heiken Ashi candles are renowned for their ability to filter out noise and eliminate false signals. Say goodbye to confusing price fluctuations and hello to a smoother, more reliable chart representation. What makes the Quantum Heiken Ashi PRO truly unique is its innovative formula, which transforms traditional candlestick data into easy-to-read colored bars. Red and g
99.99 USD
Description: First of all Its worth emphasizing here that this Trading Tool is Non-Repainting, Non-Redrawing and Non-Lagging Indicator, Which makes it ideal for professional trading and expert advisers. For limited time only 40% OFF,  Now 60$ only. 4 purchases left & the price increases to 100$ Attention, the application might not work in the strategy tester,    Try Demo here before you buy:   here . The Smart Price Action Concepts Indicator is a very powerful tool for both new and experienced
60 USD
Best Solution for any Newbie or Expert Trader! This Indicator is a unique, high quality and affordable trading tool because we have incorporated a number of proprietary features and a new formula. With only ONE chart you can read Currency Strength for 28 Forex pairs! Imagine how your trading will improve because you are able to pinpoint the exact trigger point of a new trend or scalping opportunity? User manual:   click here That's the first one, the original! Don't buy a worthless wannabe clone
128 USD
This is arguably the most complete harmonic price formation auto-recognition indicator you can find for the MetaTrader Platform. It detects 19 different patterns, takes fibonacci projections as seriously as you do, displays the Potential Reversal Zone (PRZ) and finds suitable stop-loss and take-profit levels. [ Installation Guide | Update Guide | Troubleshooting | FAQ | All Products ] It detects 19 different harmonic price formations It plots primary, derived and complementary Fibonacci p
299 USD
AW Trend Predictor MT5
AW Trading Software Limited
4.75 (51)
The combination of trend and breakdown levels in one system. An advanced indicator algorithm filters market noise, determines the trend, entry points, as well as possible exit levels. Indicator signals are recorded in a statistical module, which allows you to select the most suitable tools, showing the effectiveness of the signal history. The indicator calculates Take Profit and Stop Loss marks. Manual and instruction ->  HERE  / MT4 version ->  HERE How to trade with the indicator:  Trading wit
55 USD
TrendMaestro5
Stefano Frisetti
note: this indicator is for METATRADER4, if you want the version for METATRADER5 this is the link:  https://www.mql5.com/it/market/product/108106 TRENDMAESTRO recognizes a new TREND in the bud, he never makes mistakes. The certainty of identifying a new TREND is priceless. DESCRIPTION TRENDMAESTRO identifies a new TREND in the bud, this indicator examines the volatility, volumes and momentum to identify the moment in which there is an explosion of one or more of these data and therefore the mome
397 USD
TPSpro TRENDPRO  - is a trend indicator that automatically analyzes the market and provides information about the trend and each of its changes, as well as giving signals for entering trades without redrawing! The indicator uses each candle, analyzing them separately. referring to different impulses - up or down impulse. Exact entry points into transactions for currencies, crypto, metals, stocks, indices!  -    To maximize the potential and learn how to trade using this indicator, read the full
125 USD
FX Trend MT5
Daniel Stein
4.63 (35)
Get your daily market update with details and screenshots via our Morning Briefing  here on mql5  and  on Telegram ! Do you want to become a constantly profitable 5-star forex trader? Then  get our Stein Investments trading tools  and send us a screenshot to get your personal invitation to our exclusive trading chat with 500+ members. FX Trend displays the trend direction, duration, intensity and the resulting trend rating for all time frames in real time. You'll see at a glance at which dir
66 USD
Introducing   Quantum Breakout PRO , the groundbreaking MQL5 Indicator that's transforming the way you trade Breakout Zones! Developed by a team of experienced traders with trading experience of over 13 years,   Quantum Breakout PRO   is designed to propel your trading journey to new heights with its innovative and dynamic breakout zone strategy. Quantum Breakout Indicator will give you signal arrows on breakout zones with 5 profit target zones and stop loss suggestion based on the breako
99.99 USD
Trend Scanner mt5 GS
Vasiliy Strukov
5 (14)
Trend Scanner mt5 scans market trends from Multi-Symbols and Multi-Time frames and displays it on a movable panel on the chart. It uses  Gold stuff indicator   for analysis .The trader can select multiple pairs of his choice for display.   Trend Scanner is a great tool to see the direction of the trend and can be used for manual trading or EA trading by allowing only buy or sell orders according to the trend. Real-time results can be viewed  here . Contact me immediately after the purchase to g
149 USD
Auto Order Block with break of structure based on ICT and Smart Money Concepts Futures Break of Structure ( BoS )             Order block ( OB )            Higher time frame Order block / Point of Interest ( POI )    shown on current chart           Fair value Gap ( FVG ) / Imbalance   ,  MTF      ( Multi Time Frame )    Volume Imbalance     ,  MTF          vIMB Gap’s Equal High / Low’s     ,  MTF             EQH / EQL Liquidity               Current Day High / Low           HOD /
53 USD
TPA True Price Action indicator reveals the true price action of the market makers through 100% non-repainting signals strictly at the close of a candle! TPA shows entries and re-entries, every time the bulls are definitely stronger than the bears and vice versa. Not to confuse with red/green candles. The shift of power gets confirmed at the earliest stage and is ONE exit strategy of several. There are available now two free parts of the TPA User Guide for our customers. The first "The Basics"
168 USD
Stargogs Spike Catcher
Lorenzo Edward Beukes
5 (6)
Stargogs Spike Catcher V3.12 This Indicator is Developed To milk the BOOM and CRASH indices . Send me Message if you need any help with the indicator.  CHECK OUT THE STARGOGS SPIKE CATCHER EA/ROBOT V3: CLICK HERE ALSO CHECK OUT SECOND TO NONEFX SPIKE CATCHER:   CLICK HERE STARGOGS SPIKE CATCHER V3.12 WHATS NEW! Brand New Strategy. This is the Indicator you need for 2023. The Indicator Gives you an Entry at a time when conditions are met enter on every arrow and exit when it gives an X. New Tren
100 USD
Advanced Supply Demand MT5
Bernhard Schweigert
4.46 (13)
Best Solution for any Newbie or Expert Trader! This indicator is a unique, high quality and affordable trading tool because we have incorporated a number of proprietary features and a new formula. With this update, you will be able to show double timeframe zones. You will not only be able to show a higher TF but to show both, the chart TF, PLUS the higher TF: SHOWING NESTED ZONES. All Supply Demand traders will love it. :) Important Information Revealed Maximize the potential of Advanced Suppl
199 USD
Propsense MT5
Fahim Miah
5 (2)
Welcome to Propsense, the best solution for new and veteran traders with a simple   FREE   strategy! NEW to MT5! This indicator is a unique and affordable trading tool built on the teachings of a former bank trader. With this tool, you will be able to see inefficient points with ease. Additionally, traders will have a clean Heads Up Display which will show your running and closed P/L in pips AND currency units. As a highly requested option, a candle timer has been added which will allow you to j
50 USD
SMT Divergence MT5
Divyansh Preet Lal
5 (1)
BLACK FRIDAY PRICE: $135.00 SMT DIVERGENCE _________ This newly updated version of the   SMT DIVERGENCE   indicator now allows you to see SMT that is occurring between 2 highly correlated pairs. The   DXY   can now be added into the settings as a correlated asset. New update allows for the indicator to   scan   an   inversely correlated chart . Directly correlated asset and indirectly correlated asset can   both   be   viewed at once   on the chart. Eg., on a EURUSD chart, SMT made with GBPUSD
135 USD
Trend Forecaster
Alexey Minkov
5 (1)
The Trend Forecaster indicator utilizes a unique proprietary algorithm to determine entry points for a breakout trading strategy. The indicator identifies price clusters, analyzes price movement near levels, and provides a signal when the price breaks through a level. The Trend Forecaster indicator is suitable for all financial assets, including currencies (Forex), metals, stocks, indices, and cryptocurrencies. You can also adjust the indicator to work on any time frames, although it is recommen
89 USD
Reversal First Impulse levels (RFI)   - are the   maximum volume   levels/areas that turn the market around, so they play a critical role in future trading decisions. The logic behind the movement of any chart is that the price moves from the first impulse level (RFI) to the first impulse level (RFI) of the past trend. The first impulse level (RFI) is the most powerful level during a trend reversal, which forms a reversal zone. The first impulse level from the reversal of the previous movement i
125 USD
Golden Spikes Detector
Batsirayi L Marango
5 (1)
Golden Spikes Detector This indicator is based on an advanced strategy primarily for trading spikes on Boom and Crash Indices. Complex algorithms were implanted to detect high probability entries only. It alerts on potential Buy and Sell entries. To trade spikes on the Deriv or Binary broker, only take Buy Boom and Sell Cash alerts. It was optimised for 5-minute timeframe. Features ·          Sends push notifications to mobile phone ·          Pop up and sound alerts on computer or laptop ·     
150 USD
More from author
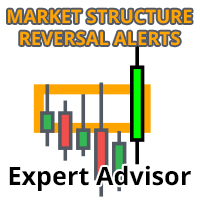
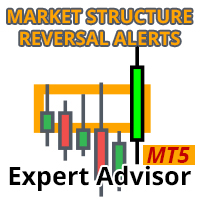
The Market Reversal EA is powered by the indicator of the same name ( available here ) and trades based on market structure shifts. The EA will by default take a trade every time a market reversal alert is sent by the indicator and will trade those alerts based on the conditions and filters you set in the EA settings. It draws support rectangles as price moves in it's current trend direction and trades when price reverses sharply and signals a market structure shift or a re-test of the reversal.
99 USD
Market Reversal Alerts
LEE SAMSON
4.17 (120)
Profit from market structure changes as price reverses and pulls back. The market structure reversal alert indicator identifies when a trend or price move is approaching exhaustion and ready to reverse. It alerts you to changes in market structure which typically occur when a reversal or major pullback are about to happen. The indicator identifies breakouts and price momentum initially, every time a new high or low is formed near a possible exhaustion point. The indicator draws in a rectangle on
49 USD
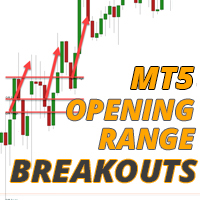
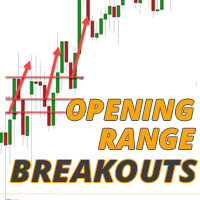
Profit from the explosive moves that occur at the open of stock indices and give yourself an actionable edge every day. The opening range breakout EA can be tweaked to your liking to capture the trends that form just after the open every day on the main stock indices like the DAX, DOW, NASDAQ and S&P500. These opens happen at the same time every day so you know when volatility will occur and often just after the open strong trends form which you can capture with this EA. The opening range is typ
99 USD
Take advantage of the opening volatility of the major stock indexes and profit from the sudden moves created at those times when the market breaks away at the opening bell. The strategies' goal is to simply benefit from those days when the market moves fast and hard in one direction at the open and bank that move. If the market opens weak and directionless, the EA locks in a hedge loss and waits for the market to decide on a direction before exiting the positions. The stock index hedge EA analys
99 USD
Automatically draw support and resistance levels PLUS propulsion candle gaps on your chart, so you can see where price is likely to head next and/or potentially reverse. This indicator is designed to be used as part of the position trading methodology taught on my website (The Market Structure Trader) and displays key information for targeting and potential entries. MT version available here:  https://www.mql5.com/en/market/product/97973 There are 2 CORE features in the indicator and 4 additiona
49 USD
This dashboard is an alert tool for use with the market structure reversal indicator. It's primary purpose is to alert you to reversal opportunities on specific time frames and also to the re-tests of the alerts (confirmation) as the indicator does. The dashboard is designed to sit on a chart on it's own and work in the background to send you alerts on your chosen pairs and timeframes. It was developed after many people requested a dash to monitor multiple pairs and time frames at once rather th
49 USD
The Market Reversal Alerts EA is powered by the indicator of the same name ( available here ) and trades based on market structure shifts. The EA will by default take a trade every time a market reversal alert is sent by the indicator and will trade those alerts based on the conditions and filters you set in the EA settings. It draws support rectangles as price moves in it's current trend direction and trades when price reverses sharply and signals a market structure shift or a re-test of the re
99 USD
The RSI / TDI alert dashboard allows you to monitor RSIs at once (selectable by you) on every major pair you trade. You can use it in two ways: 1. Select multiple time frames and the dash will show you when there are multiple time frames extended beyond normal trading conditions. A great indicator that price has pushed hard recently as it has achieved an overbought or oversold level across multiple time frames so a pullback or reversal is due soon. 2. Use one time frame (your favourite to trade)
49 USD
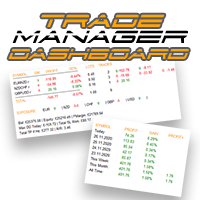
Take control of your forex portfolio. See instantly where you stand, whats working and whats causing you pain! MT5 VERSION AVAILABLE HERE:  https://www.mql5.com/en/market/product/58658 The Trade Manager Dashboard is designed to show you at a glance where each position you have in the forex market currently is, and make risk management and exposure to currencies easier to understand. For traders that scale into the market gradually with multiple positions or those trading grid and basket strate
49 USD
The ADR Reversal Indicator shows you at a glance where price is currently trading in relation to it's normal average daily range. You will get instant alerts via pop-up, email or push when price exceeds it's average range and levels above it of your choosing so you can jump into pullbacks and reversals quickly. The indicator draws horizontal lines on the chart at the average daily range extremes and also extensions above those levels which have mathematical probabilities attached to them of pric
49 USD
Profit from the explosive moves that occur at the open of stock indices and give yourself an actionable edge every day. The opening range breakout EA can be tweaked to your liking to capture the trends that form just after the open every day on the main stock indices like the DAX, DOW, NASDAQ and S&P500. These opens happen at the same time every day, so you know when volatility will occur, and often just after the open strong trends form which you can capture with this EA. The opening range is t
99 USD
The ADR Reversal Indicator shows you at a glance where price is currently trading in relation to it's normal average daily range. You will get instant alerts via pop-up, email or push when price exceeds it's average range and levels above it of your choosing so you can jump into pullbacks and reversals quickly. The indicator draws horizontal lines on the chart at the average daily range extremes and also extensions above those levels which have mathematical probabilities attached to them of pric
49 USD
Automatically draw support and resistance levels   PLUS   propulsion candle gaps on your chart, so you can see where price is likely to head next and/or potentially reverse. This indicator is designed to be used as part of the position trading methodology taught on my website (The Market Structure Trader) and displays key information for targeting and potential entries. MT4 Version:  https://www.mql5.com/en/market/product/97246/ There are 2 CORE features in the indicator and 4 additional ones:
49 USD
The ADR Alert Dashboard shows you at a glance where price is currently trading in relation to it's normal average daily range. You will get instant alerts via pop-up, email or push when price exceeds it's average range and levels above it of your choosing so you can jump into pullbacks and reversals quickly. The dash is designed to be placed on a blank chart and just sit in the background and alert you when levels are hit so you do not need to sit and watch it or even look at all! MT4 VERSION AV
49 USD
This dashboard is an alert tool for use with the market structure reversal indicator. It's primary purpose is to alert you to reversal opportunities on specific time frames and also to the re-tests of the alerts (confirmation) as the indicator does. The dashboard is designed to sit on a chart on it's own and work in the background to send you alerts on your chosen pairs and timeframes. It was developed after many people requested a dash to monitor multiple pairs and time frames at once rather th
49 USD
ADR Alert Dashboard
LEE SAMSON
3.83 (12)
The ADR Alert Dashboard shows you at a glance where price is currently trading in relation to it's normal average daily range. You will get instant alerts via pop-up, email or push when price exceeds it's average range and levels above it of your choosing so you can jump into pullbacks and reversals quickly. The dash is designed to be placed on a blank chart and just sit in the background and alert you when levels are hit so you do not need to sit and watch it or even look at all! MT5 VERSION AV
49 USD
Take control of your forex portfolio. See instantly where you stand, whats working and whats causing you pain! MT4 VERSION AVAILABLE HERE:  https://www.mql5.com/en/market/product/58375 The Trade Manager Dashboard is designed to show you at a glance where each position you have in the forex market currently is, and make risk management and exposure to currencies easier to understand.   For traders that scale into the market gradually with multiple positions or those trading grid and basket stra
49 USD
The price action toolkit EA is designed for scalpers but can be used on all timeframes to quickly enter the market with correctly calculated lot sizing based on your stop level, It allows you to quickly enter trades (instantly or at candle highs and lows with pending orders) and then adjust stops and take profits as the market moves. For a full list of all the features, settings and best practice strategy click here:  https://www.mql5.com/en/blogs/post/748072 NOTE FOR MT5 USERS: The MT5 versio
99 USD
The RSI / TDI alert dashboard allows you to monitor RSIs at once (selectable by you) on every major pair you trade. You can use it in two ways: 1.   Select multiple time frames and the dash will show you when there are multiple time frames extended beyond normal trading conditions. A great indicator that price has pushed hard recently as it has achieved an overbought or oversold level across multiple time frames so a pullback or reversal is due soon. 2.   Use one time frame (your favourite to tr
49 USD
A symmetrical triangle chart pattern represents a period of contraction & consolidation before the price is forced to breakout to the upside or breakdown. A breakdown from the lower trendline marks the start of a new bearish trend, while a breakout from the upper trendline indicates the start of a new bullish trend. MT4 Version Available Here:  https://www.mql5.com/en/market/product/68709/ This indicator identifies these patterns and alerts you when the 4 key points have formed and price has pul
49 USD
Price Action Toolkit
LEE SAMSON
4.67 (6)
The price action toolkit EA is designed for scalpers but can be used on all timeframes to quickly enter the market with correctly calculated lot sizing based on your stop level, It allows you to quickly enter trades (instantly or at candle highs and lows with pending orders) and then adjust stops and take profits as the market moves. For a full list of all the features, settings and best practice strategy to use click here:  https://www.mql5.com/en/blogs/post/748072 MT5 version available here:
99 USD
A symmetrical triangle chart pattern represents a period of contraction & consolidation before the price is forced to breakout to the upside or breakdown. A breakdown from the lower trendline marks the start of a new bearish trend, while a breakout from the upper trendline indicates the start of a new bullish trend. Get the dashboard to monitor all instruments and time frames you trade for symmetrical triangle patterns at once! https://www.mql5.com/en/market/product/69169/ MT5 Version Available
49 USD
The symmetrical triangle pattern dashboard allows you to monitor multiple markets and timeframes at once for symmetrical triangle patterns as draw by the symmetrical triangle pattern indicator available here: https://www.mql5.com/en/market/product/68709/ Visit the above indicator to learn more about how symmetrical triangle patterns are formed and simple to follow strategies to trade them. The dashboard is a stand-alone product and DOES NOT require the indicator to work. It only monitors for t
49 USD
AT LAST! A stochastic indicator for MT4 that shows multiple time frames on one chart ! See the actual position of the main and signal lines in 4 separate time frames instantly to help you make educated trading decisions.A true MTF stochastic indicator for traders that need to see visually what the indicator is telling them on multiple time frames, no arrows that just point up or down or numbers displayed. No more flicking between time frames to see where other stochastics are positioned! Stay on
49 USD
Filter:
Manuel Gonzalez
97
Manuel Gonzalez 2023.11.02 21:51 
 

This has been with complete honesty, my story and my personal experience with the indicator. I bought the indicator 1 year ago and I really hadn't set it up well because I didn't take the time to watch and listen carefully to the setup videos and strategy videos. I knew that the indicator was very good, and that it was my fault. 2 days ago I took the time to watch and listen to the instruction videos with great attention and detail; I configured the indicator properly (I use it in M15 and I can see in said timeframe what is happening in H4... Incredible!!) Therefore, since yesterday everything has changed in a very positive way. They are just gains and profits (I use it on Deriv synthetic indices on MT5 and it works excellent on all assets, whether Boom, Crash (In bullish and bearish trend) it also works excellent on volatility indices. Thank you very much Lee for having a more than excellent product. This is my opinion based on my personal experience, since I am NOT a professional trader (Thursday, November 2, 2023 - 15:49 p.m.)

built2nv
44
built2nv 2023.07.19 02:53 
 

Great Indicator works as described, if you are a seasoned trader and have your indicators that you previously used before the purchase or this indicator and you was profitable, the with this as an add on you should see even more profits flooding in with ease.....adjust your setting within the indicator and the rest will be history.

Scott Smith
72
Scott Smith 2023.07.18 17:14 
 

very impressed with this indicator - when i add this to my current strategy it makes is x10 better, very exciting for the future, highly recommended

Tyler Sanchez
518
Tyler Sanchez 2023.05.01 19:46 
 

This indicator has a lot of potential, hopefully the developer will keep updating it and adding new things.

danielfm45
19
danielfm45 2023.04.03 21:27 
 

How can I contact the developer of this indicator? I purchased the wrong version, I wanted the MT4 but by mistake I selected the MT5.

LEE SAMSON
57926
Reply from developer LEE SAMSON 2023.04.03 22:17
Not by leaving a review, on the chat system. :) If you bought the wrong one just cancel it and then purchase the correct one. As long as you have not activated it. Contact MQL5 support if you have any problems though and they can help you.
HOGJoerch63
249
HOGJoerch63 2022.12.17 14:04 
 

It is a very accurate indicator. And even if I am still testing it on my demo account, it looks constantly profitable. I am using it in the M1 Timeframe with a H1 Anchor Chart. Thank`s Lee and I really appriciate your good and proffessional work!

Antonio Fluxa Vidal
1049
Antonio Fluxa Vidal 2022.12.02 13:42 
 

I have been working with this indicator for almost a year now and it is simply essential when taking a position, as the developer explains, it must be compared with other indications, of course: it must be contrasted, as well as fundamental analysis in the case of Forex , for instance.

Simon Peter Ward
178
Simon Peter Ward 2022.09.05 11:58 
 

Brilliant!, Add an RSI and MACD to this and you'll never go wrong, already ordered my yacht...

LEE SAMSON
57926
Reply from developer LEE SAMSON 2022.09.05 12:40
Awesome! Glad you are finding it useful. Any oscillator really as a market condition indicator will help filter out false signals, two even better! :)
Mike Louw
197
Mike Louw 2022.09.01 20:06 
 

Harsh comment goldencobra. This indicator is working extremely well for me, and constitutes the basis of my trading strategy. When it repaints, it means YOU got it wrong from the get go, something I wouldn't brag about. The smart thing is to know what you don't know, so try studying the video courses available to better understand market fundamentals and put it altogether.

LEE SAMSON
57926
Reply from developer LEE SAMSON 2022.09.01 21:30
Glad you are finding it useful and thanks for the review. :)
goldencobra
119
goldencobra 2022.08.30 17:04 
 

Repaints. Don't waste your money. Total garbage.

LEE SAMSON
57926
Reply from developer LEE SAMSON 2022.08.30 17:05
The indicator draws in market structure on your chart. Market strucutre shifts so yes of course it re-draws that data. Please visit the website and watch the 20+hours of free education which will teach you how to trade market structure and you will then understand what this indicator is showing you on the chart and understand how you can use it properly. Also live rooms which are free every day too where I teach market structure and trade live with the indicator. www.themarketstructuretrader.com
Trevor Lam
88
Trevor Lam 2022.08.26 12:17 
 

Been using this indicator for 9 months now and has been very useful. A quick and easy way to identify changes in market structure and find my entries. Not to be used on it's own, but it complements my trading strategy perfectly. The Trade manager dashboard written by the same author is also superb! For those who have noticed the repainting, it's simply how it has to work as no price action can be certain moving forward (Have a read on the owners website on how the indicator actually works!) The free training on the website is also top notch.

LEE SAMSON
57926
Reply from developer LEE SAMSON 2022.08.26 12:24
Thanks for the review, much appreciated. Glad you find the website videos and toold useful. :)
beautifuldarkness
156
beautifuldarkness 2022.08.26 01:43 
 

Changes historical data....repaints

LEE SAMSON
57926
Reply from developer LEE SAMSON 2022.08.26 08:31
The indicator draws in market structure on your chart. Market strucutre shifts so yes of course it re-draws that data. Please visit the website and watch the 20+hours of free education which will teach you how to trade market structure and you will then understand what this indicator is showing you on the chart and understand how you can use it properly. Also live rooms which are free every day too where I teach market structure and trade live with the indicator. www.themarketstructuretrader.com
greatman24 GODWIN OGOABIA
30
greatman24 GODWIN OGOABIA 2022.08.12 18:02 
 

This is the Best Indicator! It's a great indicator you will find on the net that will give you a reversal based on price action many traders usually search for manual trading guiding indicators. This indicator will do chart analysis for you automatically. It's really good and great, I love it! It makes my trading so easy, gives me opportunity to trade, more potential profit to enjoy. Thank you very much sir for this great work.
Shaun Clint Hendricks
384
Shaun Clint Hendricks 2022.07.31 13:28 
 

I have yet to lose a trade with this indicator, i use it to support my trading decisions and not let it decide for me what i must do with my money. treat it as a tool and you will be golden. Thank you Lee

Samuel Tamayo Gaviria
185
Samuel Tamayo Gaviria 2022.06.04 17:25 
 

excellent indicator, very useful. I would recommend to the developer to add option of a Timeframe chart that informs the current direction given by the indicator. For example: M1: bullish - M5: Bullish - M15: Bullish - H1: Bearish - H4: Bearish.

David
141
David 2022.05.23 22:20 
 

Brilliant price action indicator, highly recommended!

David Gaganidze
325
David Gaganidze 2022.05.18 09:42 
 

good indicator

camira
224
camira 2022.05.16 20:26 
 

excellent indicator! Extremely helpful for a quick, yet accurate analysis. very fair price. Just take it!

reus39
19
reus39 2022.05.03 20:47 
 

thank you for the indicator

Christoffel Hermanus Van Wyk
224
Christoffel Hermanus Van Wyk 2022.01.19 20:11 
 

This is the Best Indicator! It's the closest indicator you will find that will give you a reversal based on price action like traders usually search for manually. Instead, this will do it for you automatically. It's Genius, I love it! It makes my life so easy, more opportunities, more potential profit!

12
Reply to review
Version 5.0 2021.08.05
MAJOR UPDATE: New features added.
View higher time frame reversals on the time frame you are trading.
Ability to hide higher time frame reversals if needed.
New retest arrows and alerts. Very powerful confirmations of trend reversals. Alerts for re-tests.
Ability to set the indicator to just alert on long or short reversals. Great for monitoring pairs you want to only enter in one direction for, trend based trading.
Added additional feature to give HTF directional arrow on all lower time frames viewed.
Tweak to order block drawing logic.
Added support for the new re-test dashboard product.
Version 3.0 2021.04.21
Update for name change
Version 2.50 2021.01.19
Small code optimizations in preparation for the release of the accompanying dashboard for MT5