RSI Live Tuner
- Indicators
- Version: 1.0

Every trader knows the ritual: open the indicator settings, change a number, click OK, squint at the chart, decide it is wrong, open settings again. And no indicator suffers more dialog roundtrips than the RSI — period 14 or 9? Levels at 70/30 or 80/20? RSI Live Tuner ends the ritual.
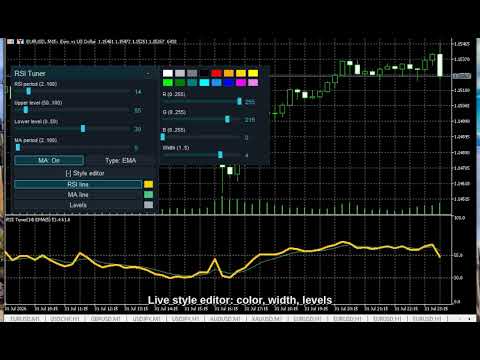
It is a Relative Strength Index that you tune directly on the chart, live. A small panel sits on your chart with sliders for the RSI period and both levels. Drag a slider and the indicator recalculates and redraws instantly, while you watch. The 14-vs-9 question, the 70/30-vs-80/20 question — answered in seconds on your own market, not in a forum thread.
Optional MA signal line. Switch a moving average of the RSI on or off straight from the panel, set its period on its own slider, and cycle its method — SMA, EMA, SMMA, LWMA — with one button. Every change lands on the chart the moment you make it.
Your own RSI, not a wrapper. The indicator runs its own clean Wilder RSI implementation — true Wilder-smoothed average gain/loss, verified numerically against the standard RSI — so what you tune is exactly what you see. Non-repaint.
Live style editor, too. Recolor and resize the RSI line, the MA line and the level lines with a 16-color palette and RGB sliders. Pick from three built-in themes (Night Cyan, Graphite Gold, Clean Light) so the panel matches your chart.
Your setup is remembered per chart — period, levels, MA state, method and period, colors and widths all come back exactly as you left them after a restart.
Why you will like it
- Instant feedback. Drag, see the result now. Settle the period and level debate on your own symbol in seconds.
- Optional MA signal line, own period slider, four methods, toggled and switched live from the panel.
- Style it live. RSI / MA / level color and width change on the chart as you edit.
- Three themes, one click, dark or light to match your chart.
- Per-chart memory. Your tuning survives restarts, chart by chart.
- Own Wilder RSI and MA math. Non-repaint. It does not trade for you — it is a decision-support tool.
How to use
- Drag RSI Live Tuner onto any chart.
- Use the sliders to set the RSI period and the two levels — watch it update live.
- Toggle the MA on the panel, set its period, cycle its method until the smoothing fits your market.
- Open Style editor to recolor / resize the lines and levels.
RSI Live Tuner is a member of the Live Tuning family, alongside CCI Live Tuner and WPR Live Tuner: free classics first, with more indicators and a multi-timeframe dashboard built on the same live-tuning workflow to follow. If the workflow saves you dialog roundtrips, a short review tells us what to build next.
Tip: If the panel ever looks transparent, your chart has "Chart on foreground" enabled (F8 -> Common) and the candles are drawn over it. The indicator deliberately respects your chart settings and never changes them — untick the option and the panel renders solid.
Free, self-contained, no DLLs. Works on any symbol and timeframe.