Flow Matrix Supply Demand
- Indicators
- Version: 2.1
- Activations: 10

Most supply and demand indicators stop at drawing rectangles. FZ-100 Flow Matrix goes further by transforming market structure into a complete decision framework. It identifies the origin of institutional-style displacement, confirms the resulting zone, evaluates its quality, monitors the retest, validates the reaction, and generates a structured risk map—all directly on your MetaTrader 5 chart.
FZ-100 is designed for traders who want more than unexplained zones. Every detected area has a structural reason, a quality score, a lifecycle, and a clearly defined relationship between entry, stop loss, and potential targets.
What Flow Matrix Does
The indicator searches for supply and demand zones created before a strong directional movement that breaks confirmed market structure.
A valid zone requires several elements:
-
A confirmed structural swing.
-
A directional break beyond that swing.
-
ATR-normalized displacement.
-
Sufficient candle-body efficiency.
-
A measurable Fair Value Gap or imbalance.
-
A valid opposite-colored origin candle.
-
Optional alignment with higher-timeframe market context.
This combination helps filter out ordinary consolidation areas and focuses attention on zones associated with genuine structural displacement.
Zone Origin and Zone Confirmation
FZ-100 clearly separates two important events.
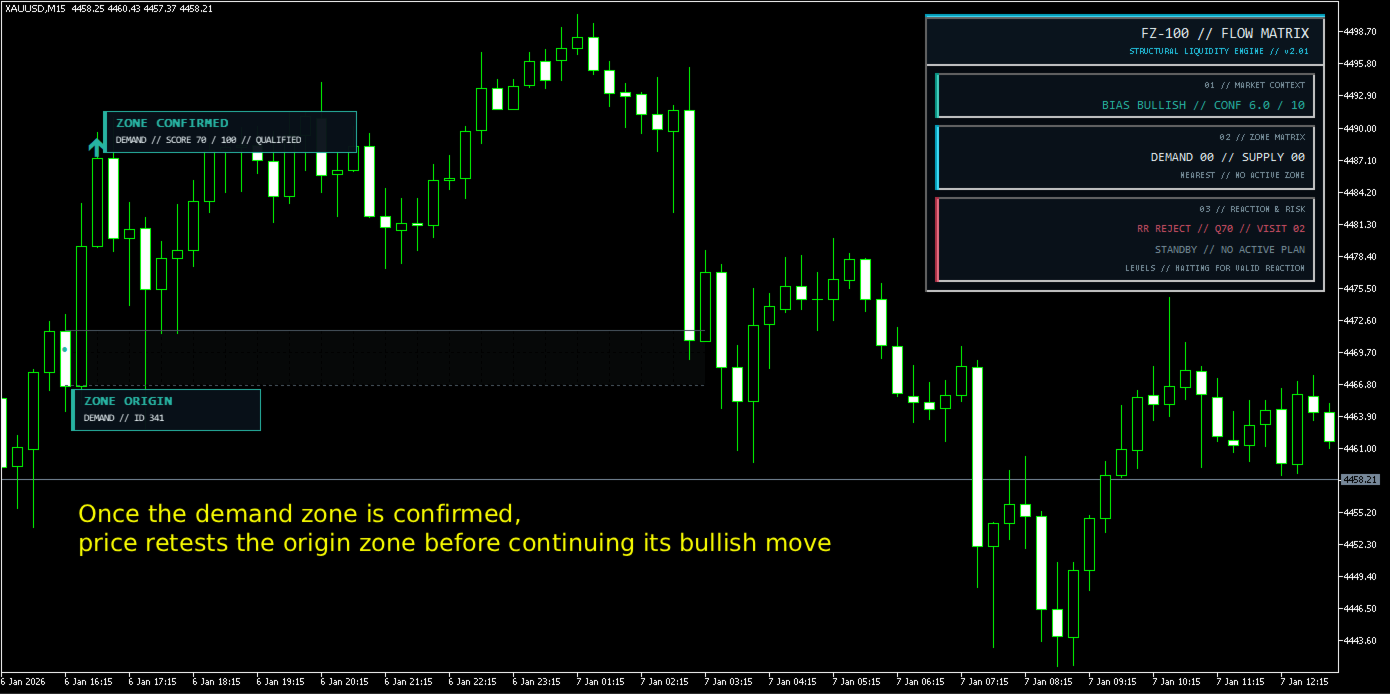
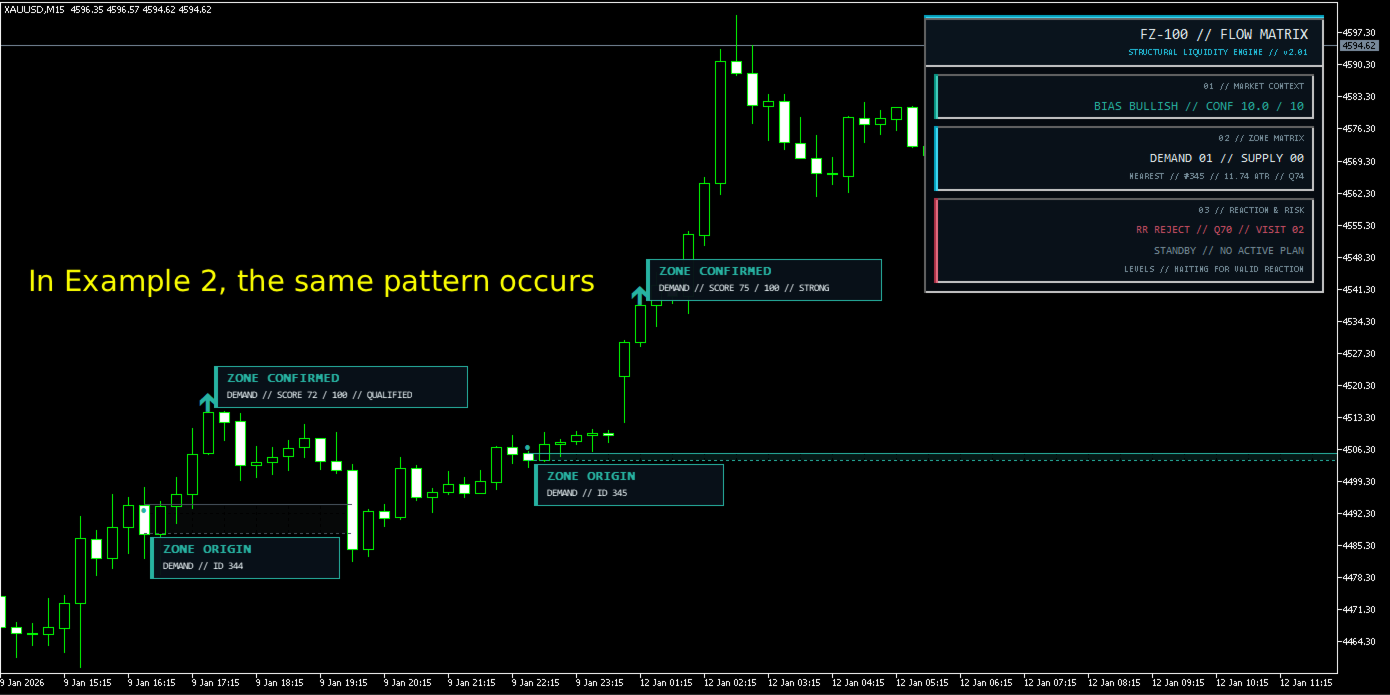
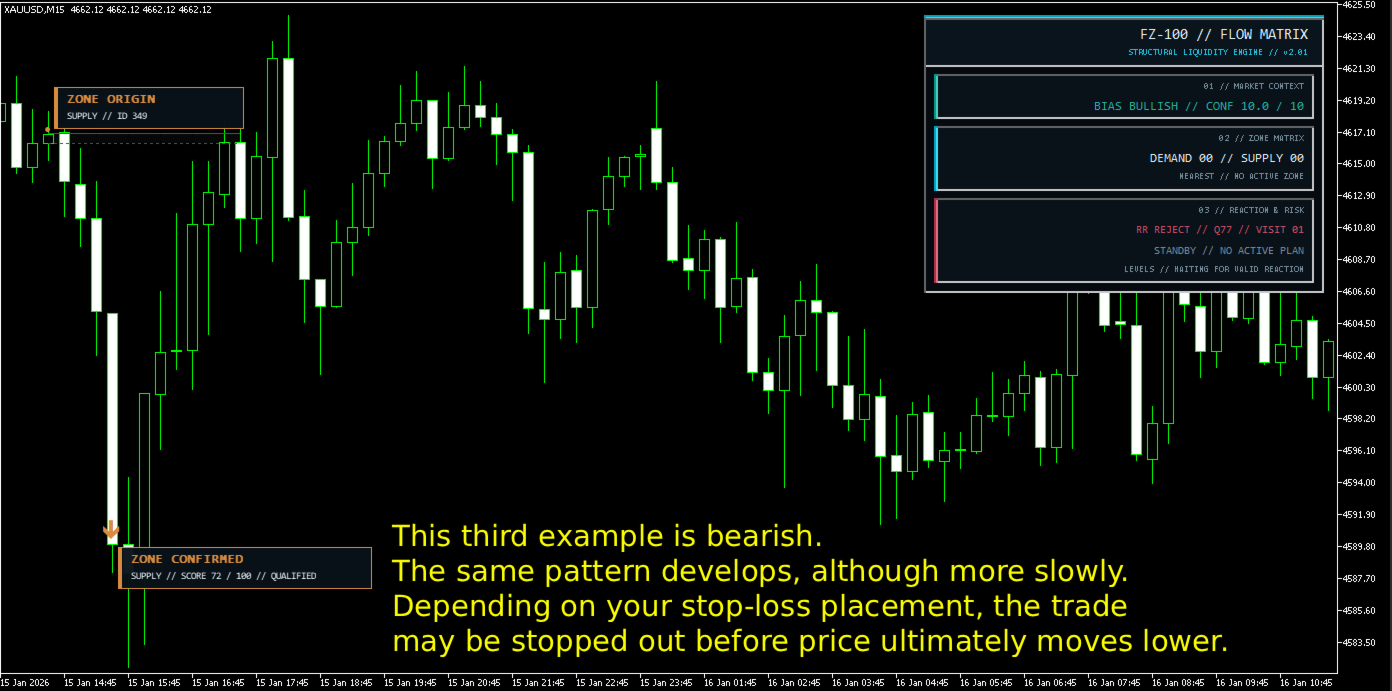
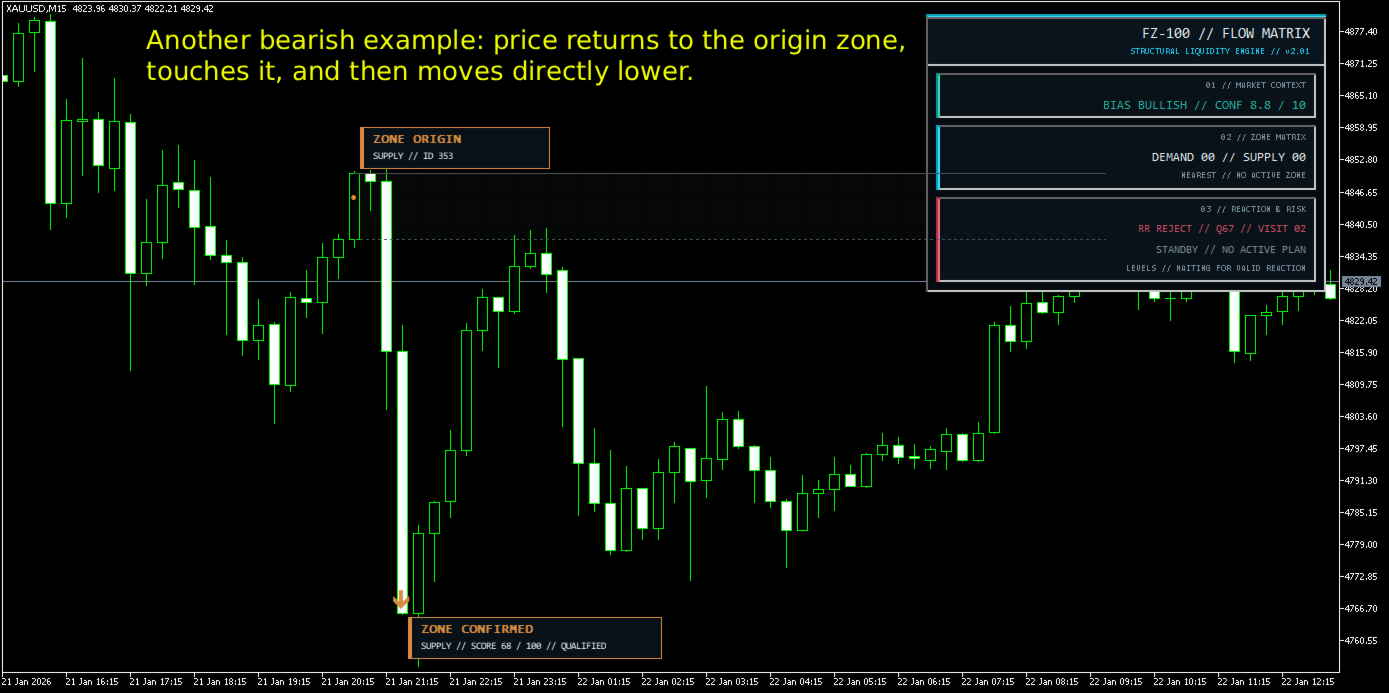
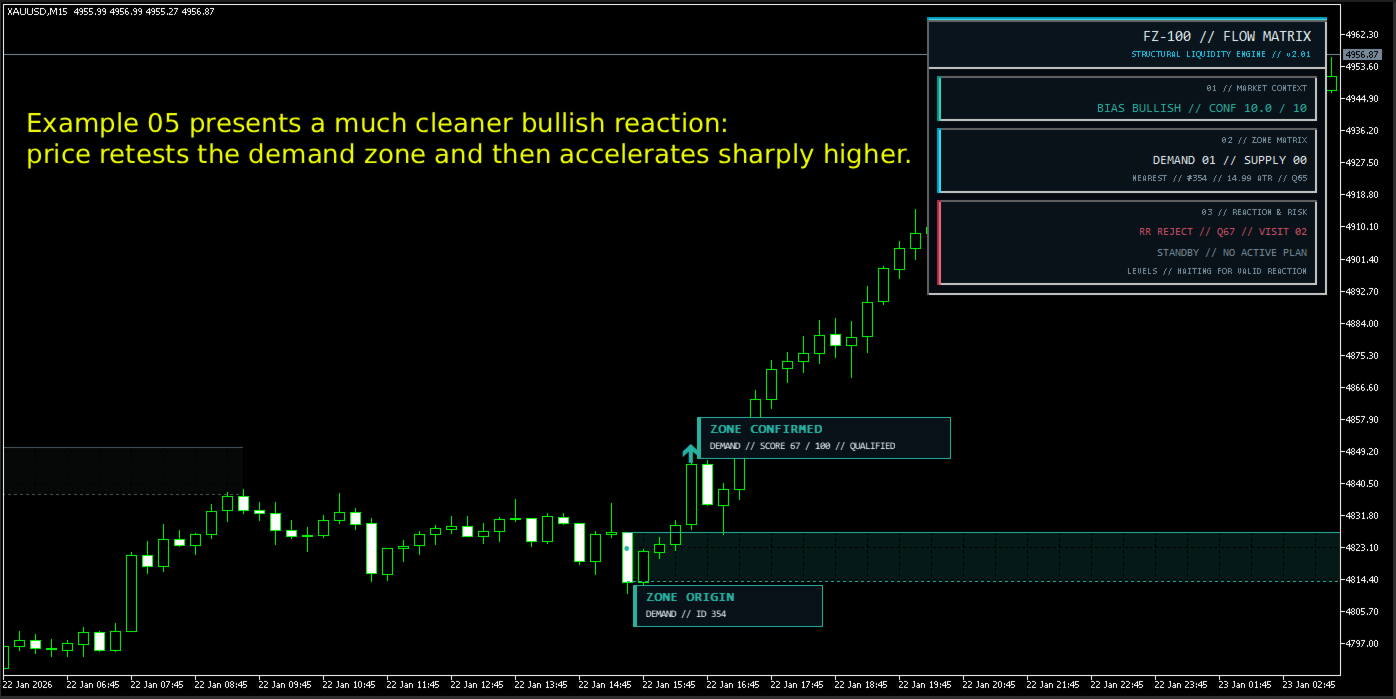
ZONE ORIGIN
This card identifies the candle from which the displacement originated.
For a demand zone, the origin is normally a bearish candle preceding a bullish structural break. For a supply zone, it is normally a bullish candle preceding a bearish structural break.
The zone uses the candle body rather than the complete wick range, producing a more precise area of interest.
ZONE CONFIRMED
The confirmation card marks the candle where the required displacement, structural break, body efficiency, and imbalance have validated the origin zone.
The origin candle is identified retrospectively only after this confirmation occurs. It must not be interpreted as a signal that was already available on the original candle.
From the confirmation point onward, the zone becomes active and can be monitored for a future retest.
Adaptive Market Structure
Instead of using a fixed swing length under every market condition, FZ-100 uses volatility-adaptive fractals.
The pivot length changes according to the relationship between current ATR and its longer-term baseline:
-
Higher volatility produces a more responsive structure.
-
Lower volatility produces a smoother structural model.
-
Minimum and maximum fractal limits prevent extreme values.
This allows the indicator to adapt its structure detection to different symbols and market environments.
Structural Break Requirements
A demand zone requires a bullish candle that closes above a confirmed swing high. A supply zone requires a bearish candle that closes below a confirmed swing low.
By default, the break must include:
-
A minimum displacement of 0.70 ATR.
-
A minimum candle-body efficiency of 55%.
-
A Fair Value Gap of at least 0.10 ATR.
These values are fully adjustable from the indicator inputs.
Origin Candle Selection
After detecting a structural break, FZ-100 searches the preceding candles for the most relevant origin.
The candidates are evaluated according to:
-
Proximity to the displacement.
-
Distance travelled from the candidate.
-
Integrity of the zone before the break.
-
Minimum candle-body size.
-
Direction relative to the displacement.
The indicator can examine several candidates and automatically select the highest-ranked origin.
Quality Score: 0–100
Not every supply or demand zone has the same quality. FZ-100 assigns each zone a dynamic score based on measurable market conditions.
The scoring model evaluates:
-
Displacement normalized by ATR.
-
Relative volume when reliable volume data is available.
-
Candle-body efficiency.
-
Size of the imbalance or Fair Value Gap.
-
Higher-timeframe alignment.
-
Zone freshness and number of visits.
-
Quality of the reaction during the retest.
-
Optional microstructure-break bonus.
If reliable volume data is unavailable, the indicator uses a neutral volume contribution instead of incorrectly penalizing the zone.
Score Classification
-
PRIME: 85–100
-
STRONG: 75–84
-
QUALIFIED: Above the configured minimum setup score
-
WATCH: Visible but below the execution threshold
-
LOW: Below the minimum visible score
The visibility and setup thresholds can be configured independently.
Higher-Timeframe Context
FZ-100 includes an automatic higher-timeframe context model.
The context score evaluates:
-
Price position relative to EMA 34.
-
EMA 34 and EMA 89 alignment.
-
EMA 34 directional slope.
-
ATR-normalized distance.
Only completed higher-timeframe candles are used in this calculation, preventing incomplete higher-timeframe data from influencing a closed-bar decision.
The context timeframe can be selected manually or calculated automatically according to the current chart timeframe.
Zone Lifecycle
Every zone is managed through a structured lifecycle:
-
FRESH — The zone has been created and has not yet produced a valid reaction.
-
ARMED — Price has returned and touched the zone.
-
CONFIRMED — A qualified directional reaction has been detected.
-
CONSUMED — The zone has already generated its setup.
-
INVALIDATED — Price has penetrated too deeply through the zone.
-
EXPIRED — The zone exceeded its maximum age or permitted number of visits.
This prevents old or repeatedly tested zones from being treated as if they were still fresh.
Retest and Reaction Confirmation
A touch alone is not considered sufficient for a complete setup.
After price retests the origin zone, FZ-100 looks for a directional reaction candle that:
-
Moves in the expected direction.
-
Closes outside the zone.
-
Remains within the permitted ATR distance.
-
Meets the minimum body-efficiency requirement.
-
Closes in a sufficiently strong position within its own range.
A break of the previous candle’s microstructure can increase the score, but it is not mandatory.
For a demand zone, the expected reaction is bullish. For a supply zone, the expected reaction is bearish.
Risk Map
When a qualified and executable reaction is detected, FZ-100 creates a complete visual risk plan.
The risk map includes:
-
Theoretical entry level.
-
Stop-loss level.
-
TP1.
-
Final target.
-
Risk area.
-
Target area.
-
Setup direction.
-
Final score.
-
Unique zone identification number.
The theoretical entry is calculated from the close of the confirmed reaction candle.
The stop is placed beyond the opposite edge of the zone using the largest of:
-
An ATR-based safety buffer.
-
A percentage of the zone height.
-
A spread-based protection buffer.
This helps the stop adapt to both volatility and the size of the detected zone.
Profit Targets
TP1
TP1 is calculated as a configurable risk multiple. Its default value is 1.25R.
The internal model assumes that 50% of the position is secured at TP1. After TP1, the protective stop is moved beyond the entry price using a small cost buffer.
Final Target
The indicator searches for the nearest relevant structural target in the direction of the setup.
If a suitable structural level exists, it can be used as the final objective. If no suitable level is available, the indicator uses the configured maximum final R target.
A setup may be rejected if the available structural reward-to-risk ratio is below the configured minimum.
Setup Protection Filters
Before creating an executable risk plan, FZ-100 checks:
-
Stop distance.
-
Current spread relative to ATR.
-
Minimum structural reward-to-risk ratio.
-
Whether another theoretical plan is already active.
Rejected setups are kept off the chart to maintain a clean visual presentation. Their status remains available through the dashboard and indicator buffers.
Flow Matrix Dashboard
The integrated dashboard provides a compact overview of the current market state.
Market Context
-
Bullish, bearish, or balanced bias.
-
Context confidence from 0 to 10.
Zone Matrix
-
Number of active demand zones.
-
Number of active supply zones.
-
Nearest zone identification.
-
Distance to the nearest zone measured in ATR.
-
Current zone quality.
Reaction and Risk
-
Most recent reaction status.
-
Final setup score.
-
Number of zone visits.
-
Active long or short plan.
-
Entry, stop loss, TP1, and final target.
The dashboard is designed to provide the essential information without filling the chart with rejected or unnecessary signals.
Alerts
Optional MetaTrader popup alerts are available for:
-
New zone creation.
-
First zone retest.
-
Confirmed reaction.
-
Filtered setup.
-
Zone invalidation or expiration.
Each alert category can be enabled or disabled independently.
Visual Customization
Users can customize:
-
Demand-zone color.
-
Supply-zone color.
-
Armed-zone color.
-
Risk color.
-
Target color.
-
Zone projection length.
-
Maximum visible zones.
-
Maximum visible plans.
-
Dashboard position and width.
-
Event-card size and spacing.
-
Visibility of zones, signals, risk maps, and dashboard.
Indicator Buffers for EA Integration
FZ-100 provides ten data buffers that can be accessed through iCustom:
-
Demand reaction price.
-
Supply reaction price.
-
Final setup score.
-
Zone upper boundary.
-
Zone lower boundary.
-
Theoretical stop loss.
-
Theoretical TP1.
-
Theoretical final target.
-
Unique zone ID.
-
Event code.
Event Codes
-
1 — Executable setup
-
2 — Rejected by spread
-
3 — Rejected by structural reward-to-risk
-
4 — Rejected by stop-distance rules
-
5 — Rejected because another plan is active
-
6 — Zone invalidated
-
7 — Zone expired
-
8 — New zone created
-
9 — Zone armed by a retest
This makes it possible for developers to create Expert Advisors, scanners, or external management tools based on the indicator’s structured output.
Closed-Bar Processing
The structural engine processes completed candles. Higher-timeframe context also uses completed higher-timeframe data.
The ZONE ORIGIN marker is placed on the historical source candle after the later structural break validates it. The actionable information begins when the zone is confirmed—not on the original candle itself.
Recommended Use
FZ-100 can be used for:
-
Supply and demand analysis.
-
Order-flow-style zone mapping.
-
Pullback and continuation setups.
-
Structural market analysis.
-
Manual trade planning.
-
Multi-timeframe confluence.
-
EA development through indicator buffers.
Because its main calculations are normalized by ATR, the indicator can be applied to Forex, metals, indices, and other sufficiently liquid markets. Different symbols and timeframes may require parameter adjustment.
Important Information
FZ-100 Flow Matrix is an analytical indicator, not an Expert Advisor. It does not automatically open, modify, or close live trades.
The displayed entry, stop-loss, and target levels are theoretical planning tools. Historical examples and internal simulations do not guarantee future performance.
Trading involves risk. Always test the indicator on historical data and a demo account before using it in live-market decisions.