Watch the Market tutorial videos on YouTube
How to buy а trading robot or an indicator
Run your EA on
virtual hosting
virtual hosting
Test аn indicator/trading robot before buying
Want to earn in the Market?
How to present a product for a sell-through
Paid Expert Advisors and Indicators for MetaTrader 4 - 29

It is based on Multiple EMA indicators. The idea is that how to display multiple Exponential Moving Averages on the chart easily without placing them one by one. It has also BLUE-RED trend lips to define UPTREND and DOWNTREND whichas BLUE is UPTREND and RED is DOWNTREND.You can change the colors by going to Indicator properties --- colors. There are 2 external setting. They are Period and Shift. When you change them (period and or shift ) then all will automatically adjust. For any currency pair
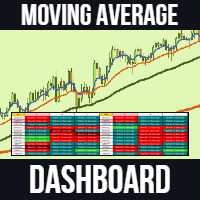
Moving Average Dashboard Pro is an improved and advanced indicator of the free version "Moving Average Crossover Bars ago Dashboard" The moving average dashboard pro gives you a dashboard view of bullish and bearish moving average crossovers. For example, if there was a bullish moving average crossover 5 sessions ago, then you would see 5 bars ago . This indicates that there was a bullish crossover 5 sessions ago. This indicator is useful if you want to catch the trend early on when using moving

Moving Average protec ======================================
The Robot is based on one standard moving average Indicator.No other Indicator required ========================================== The ea is based on a simple Moving average crossover.The default settings are already profitable.But you can change the settings and decide which averages you wan to cross. =============================================================================================== This Robot is fully automated and has

OFFER! OFFER! NEXT Price Will be 650$ and the rental option will be removed after this. Don't miss the current price offer before it is too late. Dear Traders I am so glad to introduce my Super Powers Indicator. The purpose of this trading tool is to help serious traders who want to make trading one of their main source of income. I know trading is not an easy task but if you have the right tools, knowledge and motivation to trade then you are ready to go in this industry. My role is to help y

The indicator determines the ATR value (points) in a classic way (taking into calculation paranormal bars/candles) and more correctly - ignoring paranormal movements of the Instrument. Correctly it is excluding paranormal bars from the calculation, extremely small bars (less than 5% of the standard ATR) and extremely large bars (more than 150% of the standard ATR) are ignored. The Extended version - allows you to set calculation parameters and a lot of other input parameters Ver

The portfolio was developed for the currency pair EURUSD time frame H1 . The portfolio consists of 6 strategies - each with different logic merged into one . It is designed for intraday/swing trading - no scalping, martingale, grid, etc. The EA pass through rigorous testing of robustness and is tested on over 15 years of data with 99% modeling quality! Intended for EURUSD H1. Each strategy has its own logic - a different approach, different rules. EA is designed for UTC+2 timezone with New York
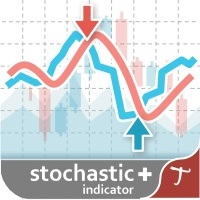
Tipu Stochastic is the modified version of the original Stochastic Oscillator published by MetaQuotes here .
Features Choose three types of signals (Reversals, Main Signal Cross, and Overbought/Oversold Cross). Customizable Buy/Sell alerts, push alerts, email alerts, and visual on-screen alerts. Marked overbought and oversold levels. Add Tipu Panel (found here ) and unlock the following additional features: An easy to use Panel that shows the trend + signal of the selected time frames. Show St
Introducing the Engulfing Goddess Metatrader 4 (MT4) Indicator , a revolutionary tool designed for traders who seek to harness the power of candlestick patterns in their trading strategy. This indicator is built on the principles of engulfing candlestick patterns , a popular method used by successful traders worldwide. Our Engulfing Goddess Indicator stands out with its ability to detect various kinds of engulfing patterns . It employs a range of filters, providing you with a comprehensiv

Round Numbers And Psychological Levels (Multi Pair And Multi Time Frame) : ---LIMITED TIME OFFER: NEXT 25 CLIENTS ONLY ---46% OFF REGULAR PRICE AND 2 FREE BONUSES ---SEE BELOW FOR FULL DETAILS Studies show that more orders end in '0' than any other number. Also know as 'round numbers', or 'psychological levels',
these levels act as price barriers where large amounts of orders will generally accumulate. And the larger the number,
the larger the psychological significance. Meaning that even
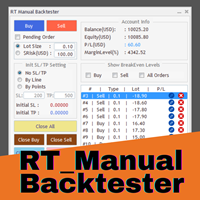
Enhance Your Manual Backtesting Experience in MT4 Strategy Tester with Our Powerful Trading Panel
>> The demo version allows a maximum of 5 orders and is limited to testing on EURUSD the M1 timeframe only. <<
Transform the way you practice and test your trading strategies in the MT4 Strategy Tester.
The RT_ManualBacktester enables you to execute trades and manage your orders more effectively,
providing a seamless manual backtesting experience. With RT_ManualBacktester , you can:
-

Void is an advanced grid system that has been operational on real accounts for several years. Unlike many systems that rely on historical data, Void was specifically created to capitalize on existing market inefficiencies, using real market mechanics to generate profits effectively. It supports currency pairs like any currencies in any timeframe. It enters trades without any rules. So, it will directly enter a new trade when you attach to the chart. IMPORTANT! Start trading as low as $40 with
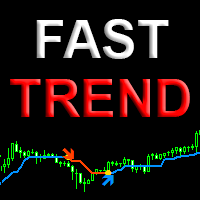
Fast trend is a professional version of the trend direction indicator and entry points. The indicator with high probability determines the direction of the trend on any currency pairs, stocks, cryptocurrency without redrawing the result. To determine the trend, it uses Price action and its own unique filtering algorithm. Suitable for all types of trading, both for scalping and for long-term trading. This version of the indicator is another branch of the evolution of the Simple Trend indica
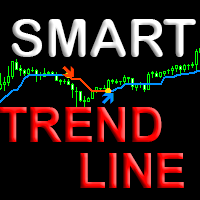
Indicator with an innovative algorithm for determining the direction of the trend. Shows the best results for determining the trend on any currency pairs, stocks, cryptocurrency without redrawing the result. It will help you immediately determine the profitability of the current pair and timeframe. Uses Price action patterns in conjunction with the author's unique algorithm. Suitable for both beginners and professionals for all types of trading. How to choose a profitable timeframe and optimize
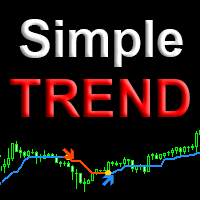
Simple trend is a professional version of the trend indicator and entry points. It uses Price action and a unique filtering algorithm to determine the trend. Shows the change in the direction of price movement on any currency pairs, without redrawing the result. Suitable for determining entry points for scalping and swing, as well as for intraday, medium-term trading. Features Marks trend reversal locations and directions. Suitable for all types of trading, in any markets. Allows you to enter

The utility refers to probabilistic analysis tools, in particular the Monte Carlo method. The Monte Carlo method is defined as the simulation of processes in purpose to evaluate their probabilistic characteristics and apply them to the solvable task.
Operation features The simulation uses a tick model with the subsequent transformation to the candles form, as a model as close as possible to the real market process. The utility generates a stream of a random tick sequence until a result with th

The EA uses sophisticated AI to use the outcome of high impact news during the US session to detect the direction of the market. The system will analyze a vast amount of data in split seconds in real time - rather than relying on outdated indicators using historical data - to trigger either a buy or sell trade in the direction of the new trend until it hits the profit target.
Please remember to change the “WorkMode” settings to “mode_Real” for the EA to work. The Expert Advisor will co

The Gold pips EA breakout advisor works from levels with Buy Stop and Sell Stop pending orders, for price changes at a certain point in time, the maximum and minimum of the bar act as levels. The advisor does not use dangerous strategies such as martingale, grid and averaging. To achieve the best results, it is very important to use LOW SPREAD accounts!
Recommendations:
Currency pair: XAUUSD, but you can use any. Timeframe: M5, M15 Minimum deposit: $50 Account type: ECN, Raw or Razor with v

BeST_Darvas Boxes is an MT4 Indicator based on the trading method developed in the 50’s by the Hungarian Nicolas Darvas . BeST_Darvas Boxes indicator draws the Top and the Bottom of every Darvas Box that can be confirmed on the current Chart. draws Buy and Sell Arrows for every confirmed Upwards or Downwards Breakout of the above levels. draws always only after the bar closing and so is non-repainting or backpainting .
Note : Every customer who wants to have the older version v_1.75 with t

This multi time frame and multi symbol indicator identifies fractals patterns. As a bonus it can also scan for Parabolic SAR (pSAR) trend changes. Combined with your own rules and techniques, this indicator will allow you to create (or enhance) your own powerful system. Features
Can monitor all symbols visible in your Market Watch window at the same time. Apply the indicator to just one chart and instantly monitor the entire market. Can monitor every time frame, from M1 to MN, and sends you a
This multi symbol indicator has been designed to automatically identify when price reaches major psychological levels. Also known as round numbers, whole numbers or key levels. As a bonus it can also scan for pivot point level on one selected time frame. Combined with your own rules and techniques, this indicator will allow you to create (or enhance) your own powerful system. Features Can write the signals to a file which can be used by an Expert Advisor for auto trading.
Can monitor all symbol

This multi time frame and multi symbol indicator identifies high-probability breakout patterns. It does this by identifying strong, symmetrical pennants and triangles. This pattern DOES NOT appear very often on higher time frames. But when it does, it is a very high-probability setup. The indicator also includes an Inside bars scanner. It can for example be used to detect a special type of Inside bars formation which is formed by a Master candle (MC) followed by 4 inside candles (please see the

The professional utilities "Ichimoku Waves Meter" to analyse graphs using the correct interpretation of Ichimoku kinkōhyō!
Is a graphic program that allows traders to quickly and easily measure the proportions between the indicated points on the price graph. This time and price indicator is a basic tool for analysing the chart according to the Ichimoku strategy on the MT4 platform. Using this tool allows an insightful and complete analysis of time waves as well as price waves in a very short t

The professional utilities "Ichimoku Waves Meter" to analyse graphs using the correct interpretation of Ichimoku kinkōhyō!
The indicator allows us to use Time Theory and Target Price Theory at the same time. The obtained image shows the convergence of waves, which confirms the accuracy of the analysis. It is possible to hide the graphical or numerical informations that are notinteresting at the moment. The indicator uses numerical values of Hosoda, which it recognizes on the chart and then emp

EA Garuda Fire MT4 .This is the logical development of EA Dragon Fire ultimate, with the addition of better logic and confirmation than before. EA Garuda Fire MT4 is a trend following system for swing trading based on PLT indicator filtered by I-gentor LSMA. no need to add any indicators because everything is included in this EA code, so the trading decisions are simple and immediate without confusion that can result from the use of many indicators
Only 10 download of the EA left at $6

Dragon Fire Ultimate Version is a tren following system for swing trading or scalping .trend based on candlesticks and look for corrections or continuations on the trend. you can use period candle or 7 or whatever you want . this time it is the ultimate version modified by our team which has many features that can be adjusted according to your needs in trading with robots. You can also do this backtest Only 5download of the EA left at $79! Next price --> $99 Symbol XAUUSD, EURUSD, GBPUSD A

FoxTrotTWO EA is a scalper Expert Advisor intended for EURUSD. It is also available for other major pairs and cross currency pairs. Recommended timeframe is M15. FT2 trades a narrow range at night. At the top and bottom of the range, FT2 will try to generate trades in the opposite direction. To open suitable trades, the Expert Advisor uses several indicators and analyzes several timeframes. But the trades are generated by price actions and are not opened by the indicator. FT2 requires a modera
Note: This indicator cannot be tested in the strategy tester. Please download the free demo version from https://www.mql5.com/en/market/product/48627 RFX Delta Volume is an indicator to show bullish and bearish volumes separately for each trading candle. The indicator uses history data of one minute (M1) to estimate the true bullish and bearish volumes in a sub-window. There are two modes of operations for this indicator. In mode "Delta Volume", the indicator shows the difference in bullish a

Special Premium Gold Micron is Spacial a symbiosis of trading algorithms. Designed for trading for XAUUSD (GOLD) pairs With Newsfilter. Has protection against failures – when the connection is restored, the advisor will continue to work with its orders. Advanced settings of trailing and trading time intervals allow the EA to work correctly on a computer and VPS. The robot controls the volume of trading positions, slippage, and spread changes. Automatically adjusts trailing taking into account
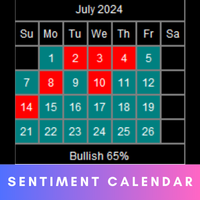
The Market Sentiment calendar provides a visual representation of market sentiment for each day or month. It will display daily and monthly BIAS . The calendar also highlights the percentage of bullish days or months within a given month or year. MT5 version - https://www.mql5.com/en/market/product/120768/ Inputs Frequency: Choose between "Daily" and "Monthly" calendar views. Sentiment Method: Select the method to determine daily or monthly sentiment: " L inear Regression ", " Accumulated Delta

Kangooroo is the advanced grid system which already works on real accounts for years. Instead of fitting the system to reflect historical data (like most people do) it was designed to exploit existing market inefficiencies. Therefore it is not a simple "hit and miss" system which only survives by using grid. Instead it uses real market mechanics to its advantage to make profit Only 5 download of the EA left at $555! Next price --> $1111 Symbol AUDCAD, AUDNZD, NZDCAD,GBPUSD,EURUSD Timef
Analyzing of multiple charts has always been one of the biggest challenges for professional traders. However, this can be overcome by increasing the number of monitors. But we'll give you a simple, cost-effective solution here.
A simple Solution ISO Charts Organizer (Chart Clipper) allows you to categorize a large number of open charts without having to increase the number of monitors and easily access them all quickly or enjoy auto switching feature.
All features that you need Charts can be

Gold Pro MT4 is a trend indicator designed specifically for gold and can also be used on any symbol. The indicator does not redraw and does not lag.
Free Dashboard : monitor All pairs and timeframes here: https://www.mql5.com/en/market/product/60431 SETTINGS Factor 1: use to calculate different methods of drawing indicator line Factor 2: use to calculate different methods of drawing indicator line AlertByPopup - true/false popup alerts. AlertBySound - true/fals

BPS BoS - Break of Structure
BoS - Fractal mode , MTF
BoS - Zigzag mode , MTF
Show HH and LL
Alerts - Popup , Push notification and eMail Option to create screenshot on alert Enable / Disable Indicator with a button on chart to select options
Choose corner of button location
It is not a system but a indicator to help identify break of structure points
MT5 version here : https://www.mql5.com/en/market/product/84734?source=Site+Profile+Seller
Other Indicators : https://www.mql5.

i-Orders is a simple indicator to monitor your own trade/analyze others' trades. I use it for a long time and do not imagine a chart without these arrows, lines and trade result numbers. The features allow you to:
disable display of opened and closed positions ( Show OPENED , Show CLOSED , Show PENDING ), change colors of arrows and lines for profitable and loss-making buy and sell positions separately ( Color for profitable/ losing BUYs/SELLs ), change style and width of the lines connec
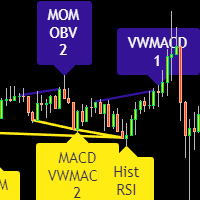
Divergence indicator 10 different indicators. Finding and displaying classic and hidden divergences.
Indicators in which divergences are searched: MACD MACD Histogram; RSI; Stochastic; CCI; momentum; OBV; VWmacd; Chaikin Money Flow; Money Flow Index. This is a replica of the indicator from the tradingview resource, adapted for the MT4 terminal.
MT5 version available here: https://www.mql5.com/en/market/product/87879
Settings: Bars in history for analysis - number of bars for analysis; Di

All Symbols AND All Time frames Scan
Document Introduction
A breakout refers to when the price of an asset moves above a resistance zone or moves below a support zone. A breakout indicates the potential for a price trend to break.Break provides a potential business opportunity. A break from the top signals to traders that it is better to take a buy position or close a sell position. A breakout from the bottom signals to traders that it is better to take sell positions or close the

Renko Charts with Heiken Ashi Filter now have the alerts and the Win-rate . Now you can know which signal will give you that edge your trading needs. Risk to Reward Settings Wins versus Losses Count There are four alert types to choose from for notification on screen, email or phone notification. The alert types also have buffers for use with automation. This indicator can be incorporated with any system that requires renko charts. The four (4) alert types are: Three-bar Formation ; Pinbar

Introducing Candle Strike EA , the groundbreaking MQL5 expert advisor that's transforming the way you trade your favorite pairs! Developed by a team of experienced traders with trading experience of over 10 years. Presets for EA here *Promotional Price: $50. The price will increase $25 with every 5 purchases. =>2 purchased ===> remain 3 then price up to $75 My Recommendation Broker Go here
Important Stuff USE M15 (You may try another Time Frame) MAIN PAIR : GBPUSD Another PAIR : A

The initial price is 150 USD, the future price is 250 USD
Smart Neuro Trade Robot - The EA does not use the usual strategies for trading. The EA traps the price, gradually adding it up from orders opened using a safe and profitable strategy. He does not use dangerous strategies like martingale and its varieties. In whatever direction the market moves, the adviser will in any case close a series of orders in plus, because he will open deals in both directions and when he gets a profit h

THE AD FOREX EA is based on the Average Directional Index (ADX)
This EA is created to work on all Time Frames and all Currency Pairs. The Robot is based on one standard Indicator.No other Indicator required. Different settings possible SL and TP Trailing Stop Martingale The best option is to use the Day Chart.
The Ea is very good for longterm Growth Works best on higher Time Frames as there will be more data collected. It works as well on cent accounts.
I wish everyone who purchases the

-40% OFF
I will keep the PRICE VERY LOW so all can have this utility!!!
Join the telegram Group.
Copy Paste the following address: https://t.me/+nW-jTNrIjwM3YjJk or contact me. Or follow the link under my profile
This is just a simple copier program that ONLY allows you to locally copy transactions between different MetaTrader 4 a accounts in any direction and quantity as quickly and easily as possible .Of course it does that. This copier DOES MUCH MUCH MORE!!! PLEASE READ BELO

About Scanner:
Detailed blog post is here: https://www.mql5.com/en/blogs/post/749119
BB Squeeze Scanner uses bbsqueeze.ex4 in background to calculate when BB Squeeze (Bollinger Bands Squeeze) happens and when BBands expand. It is attached with the above blog post.
What is Bollinger Bands Squeeze:
The Bollinger bands squeeze is a special pattern when the volatility of a market decreases after trending periods. It is generally observed the price is ranging during this period until a

About Scanner:
It will show you the Higher/Lower Highs and Lows of zigzag price. Use it to keep track of best ongoing trends and price ranges.
Detailed blog post:
https://www.mql5.com/en/blogs/post/750232
Symbols:
HH: Higher Highs HL: Higher Lows When price makes higher and higher Highs or higher Lows:
It will count Zigzag in reverse and find total number of last "Higher Highs" and "Higher Lows" or "Lower Lows" and "Lower Highs". LL: Lower Lows LH: Lower Highs
How to Use:
Suppose

Smart Reversal Signal is a professional indicator for the MetaTrader 4 platform; it has been developed by a group of professional traders. This indicator is designed for Forex and binary options trading. By purchasing this indicator, you will receive: Excellent indicator signals. Free product support. Regular updates. Various notification options: alert, push, emails. You can use it on any financial instrument (Forex, CFD, options) and timeframe.
Indicator Parameters Perod - indicator calcula
Welcome to the Premium AI EA ===============================================================================================
This Robot is based on minimum 12 Indicators and will generate long term profit.
You can also join the Telegram group TRY IT ON 4H
https://t.me/joinchat/UATYdB2oNJg29xfKqg81gg
=============================================================================================== This Robot is fully automated and has been created for everyone. The Robot works also on cen
High-speed trades duplicator, specially designed for copying trades with adjusted lot size and direction at same account. It can be aslo useful for subscribers of SIGNALS service. If you are a subscriber of trading signals then you can see that trading lot size could be different from signal provider to subscriber. Provider can use too big or too small lot size that can be inappropriate for your deposite amount (too risky). Another feature of this copier is a trading direction reverse. It can b

Important!! ZO Trend can't work on MN timeframe. /*--------------------------------------------------------------------------------------------------------------------------------------------------------------------------------------------- ZO Trend an indicator used to search for entry point. With the session candle algorithm on many timeframe, ZO Trend creates an area for traders find good Entry Point. ZO SYSTEM BASIC SETUP : https://www.youtube.com/watch?v=qdNOXHWozNw ZO TREND User guide :
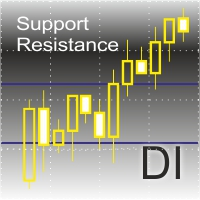
The indicator shows support and resistance levels on the chart.
Features: It shows support and resistance levels for the last 12 months. Shows the High and the Low of the last week. Shows the "MA 200" value. Shows gaps with a preset filter.
The indicator settings: ShowMA200 – show/hide the MA 200 value. ColorMA200 – the MA 200 line color. LineStyleMA200 - MA 200 line style. LineWidthMA200 - MA 200 line width. ShowMonth - show/hide support/resistance levels. ColorMonthL – line color. LineStyl

The indicator shows De Mark patterns and gives trading signals in the form of arrows and alerts. Shows De Mark lines on the history of quotes. Has a multiframe., Can show DeMark patterns of higher timeframes on lower timeframes. Has a switchable function for displaying fractals. Trading signals are accompanied by sound alerts, as well as sending them to mail and mobile devices.

Indicator that alerts by push notification to the mobile phone or by alert on the platform of the touch of the candle with the selected average. The alarm can be set to receive "x" seconds before the candle closes. Specially suitable for those who cannot or want to spend a lot of time in front of the screens to see a movement start from a moving average and therefore miss the movement. You can configure any average method and the time to receive the alert before the candle closes.

"Make it Horizontal" will convert any trendline to horizontal by just selecting it and then pressing the H key. This tool must be included in your charts as an indicator. It has no inputs, just drag it to your charts and that's it! I created this tool because the MT4 doesn't have any built-in feature like this. How many times have you drawn a line and you need to double click it in order to configure the start and end price level so you can make it horizontal? Well, that's not an issue anymore!
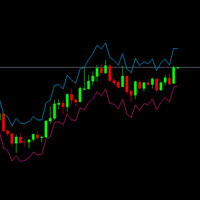
For all temporalities and all charts. Based on the ATR indicator. Calculates and draws on the chart the appropriate points to place Stop Loss or Take Profit according to the current market volatility. The following inputs can be adjusted for a more customized use of the indicator: ATR_Period: number of previous candles to be taken into account for the calculation. ATR_Multiplier: Number by which the ATR will be multiplied to draw the points on the chart. A low multiplier will mean a high risk a

VWAP Bands Metatrader 4 Forex Indicator
The VWAP Bands Metatrader 4 Forex indicator is a quite similar to the Bollinger bands, but it deploys volume weighted average as the core value of the bands. There is an option of using the tick volume or real volume for calculation when using the VWAP Bands Metatrader 5 custom forex indicator, especially when the forex broker displays symbol alongside real volume. Similarly, you can decide to have deviations calculated with the sample correction or not

Some candles have a strong tendency to continue the movement or to revert it. With the help of the Colored candles indicator such movements are clearly visible. This indicator calculates the parameters of each candle, as well as its volume, and after that it paints the candles depending on its strength and direction. Bullish candles are colored green and bearish candles - red. The greater the power of the bulls or the bears, the brighter the color. You can change the colors if you want. The indi

Based on commonly used ZigZag indicators, in-depth mining was conducted on the indicators, with two main improvements: 1、 Annotate each ZZ price point; Annotate the distance points between adjacent ZZ points for a more convenient and intuitive view of price fluctuations. 2、 Draw a Fibonacci line for the current price direction of ZZ. The Fibonacci line includes two types: the Fibonacci retracement level and the Fibonacci expansion level. When the last four ZZ points comply with Dow's 123 rule,
Ichiichiichiku This EA trades based on the ADX, ADX rising/falling, Di+ and Di- difference, RSI, 5-timeframe 2-ichimoku conversion, base line, total 10 MAs indicators. Can trade single bets, can trade Martingale. This EA is suitable for all markets, including gold, indices, forex, and more.
======
一齊一齊一齊沽 此EA跟據 ADX, ADX 升緊/跌緊, Di+ 和 Di- Difference, RSI, 5 個 TimeFrame 2 條 ichimoku conversion, base line 指標共10條MA, 作出交易; 可玩單注, 可玩馬丁 此EA適用於所有市場, 黃金, 指數, 外匯......

automatically closes orders from a preconfigured number of pips.
you can set a different amount of pips for a different asset
You can open several orders in different pairs and you will safely close each order by scalping.
a friendly EA easy to use and very useful
open orders and don't worry about closing the orders since this EA will close automatically
close all trades profits
Hello; The product offers high quality trend tracking. Thanks to the arrows on the graph, you can easily follow the entry and exit signals. It provides ease of use thanks to a single input parameter. You can easily follow the signals thanks to the alarm options. Moreover, trend color lines provide convenience in determining the trend direction. Input parameter setting: Periodic: Indicates the number of bars that need to be calculated.
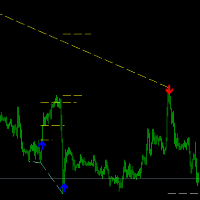
Stock! Now there is a special price for the first 10 buyers. Hurry up. Divergence HiLo is an indicator that identifies highs and lows prices (High end Low) . Based on a special algorithm, the indicator determines the value of divergence or convergence. In addition to divergence or convergence values, the indicator determines the expected take levels profit. The price chart shows divergence lines, possible profit levels and arrows that indicate the formed signal of the indicator in buy or sell.

This is a multicurrency and multitimeframe indicator that calculates the angle between two points. Points for measuring the angle can be taken from the ZigZag (the last two points), or from the Moving Average (between two given bars), or it can be the closing prices of bars.
Angle measurement is possible in degrees or in radians. You can select the scale for the calculation. For a better understanding of the indicator, you can study the free Angle High Low indicator. In the parameters you can

News Filter EA that send you a Push notification to your MT4 phone APP and TURN OFF MT4 Automatically Before News. This EA doesn't work in backtest From 1.7 version the EA have Close all trades before news functions added.
You only need to allow that url in MT4 options: To see the url and how to add it to MT4, visit this post:
https://www.mql5.com/en/blogs/post/754402
When Metatrader is turned off, it saves the status of all the charts, indicators and Expert Advisors that you have in t

The Quality trend indicator expresses the ratio of the strength of a trend or the speed of its growth (fall) to the degree of its noisiness or a certain norm of amplitudes of chaotic fluctuations of a growing (falling) price. The position of the indicator line above zero shows an increasing trend, below zero - a falling trend, the fluctuation of the indicator line near zero shows a flat. If the indicator line begins to fluctuate rapidly around zero and approach it, then this indica

The indicator signals the appearance of a possible divergent bar based on the shape of the bar without angulation detection. A bullish divergent bar is a bar that closes in its upper half (the higher the better), has a lower minimum than the previous bar, and drops sharply away from the Alligator indicator. A bearish divergent bar is a bar that closes in its lower half (the lower the better), has a higher high than the previous bar, and moves up sharply from the Alligator.
SETTINGS History - h
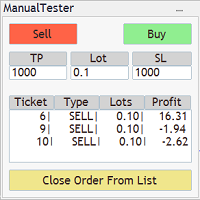
The Manual BackTester Panel utility allows to simulate the manual trading in the MetaTrader 4 strategy tester. The panel works only in the virtual mode of the MetaTrader 4 strategy tester. The demo version allows to open and close ten orders, then the program will automatically turn off. The utility has no parameters at initialization.
Panel Description: The panel has Buy and Sell buttons for placing market orders. It is possible to set the Take Profit and the Stop Loss in the TP and SL fields

The Prop Trading Scalper indicator is a tool used for manual traders to assist in passing prop trading challenges, which are evaluations set by proprietary trading firms to determine a trader's skill and discipline. This indicator is particularly designed for scalping, a strategy that involves making numerous small trades to capitalize on minor price movements.
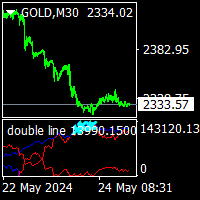
double line indicator is no repaint trend indicator. it can be use all pairs and all timeframes. it is wery ease to use.also beginner can use. it gives gold and aqua points on the double lines. aqua points is come when the prices is down. and gold points is come when the prices is on top. it can be used all time frames and all pairs. suitable for experienced and beginners traders.
With this automatic trading software, the transaction is entered into when conditions comply with the rules of the algorithm (settings that can be changed by you). When a certain profit occurs, the system automatically takes profit and closes the transactions.
You can benefit from many unique features of the control panel. Detailed information about its use will be shared with people who purchase it.

In addition to understanding market trends and logic, surviving in the forex market requires a grasp of risk management, discipline, and a sound trading strategy. While the Grid EA you mentioned may offer a simplified approach, it's important to note that relying solely on grid trading without a deeper understanding of market dynamics and risk management could be risky. Grid trading strategies involve placing buy and sell orders at regular intervals or price levels, aiming to profit from market
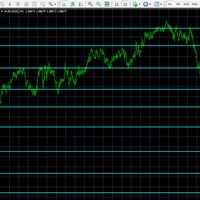
A powerful chart indicator which intelligently analyses Index, FX & Commodity prices to identify the strongest support and resistance price boundaries. Each line shows where prices consistently close, while the frequency of these matching prices is quoted to reflect each boundary strength. Use these predictive boundaries to identify pivot points, resistance and support levels for crossover, trending, reversal and channel strategies. For FX pairs, set volatility filter = 1 For Indices & Commodi

Default settings:XAUUSD(GOLD)M1,M5,M15 No repaint, no redraw, no recalculate Can be optimized in all pairs You can fully optimize it and apply it to your strategy You can use it alone or in addition to your strategy. Suitable for beginners You will see the trading zones and identify the most profitable points to open positions. To open an order, the price must be in the yellow zone Full entry points, 5 different take profit zones https://www.mql5.com/en/users/ummuhan/seller For your questions an
Do you know why the MetaTrader Market is the best place to sell trading strategies and technical indicators? No need for advertising or software protection, no payment troubles. Everything is provided in the MetaTrader Market.
You are missing trading opportunities:
- Free trading apps
- Over 8,000 signals for copying
- Economic news for exploring financial markets
Registration
Log in
If you do not have an account, please register
Allow the use of cookies to log in to the MQL5.com website.
Please enable the necessary setting in your browser, otherwise you will not be able to log in.