Hi, i have a small budget, i want the cost under $, if thats possible. I dont mind to enter manually the details of the stock split (using seeking alpha data) to keep the cost down and possibly as a second project , to automate it. I already have system that are working well with unadjusted data from stock price split. So i'd like to choose if i want to use a chart with or without stock split data. Is that possible
PLEASE READ: IF YOU ARE NOT GOING TO ACCEPT THE BELOW THEN PLEASE MOVE ON TO THE NEXT CLIENT. I NEED SOMEONE WHO WILL DO THE WORK FIRST AND THEN CREATE A BUILT-IN DEMO INDI AS PER SPECIFICATIONS BELOW WHICH HAS AN EXPIRY (A DAY OR 2) SO THAT I TEST THE INDI BEFORE WE CREATE THE ORDER. I HAVE HAD PEOPLE WHO PRESSURE ME TO CREATE THE ORDER AND THEN THEY END UP DEVELOPING A FAULTY INDICATOR. AND I HAVE GIVEN THEM THE
I need an EA that can consistently make profits with low drawdowns and no dangerous martingale or grid. Requirements: - EA needs to open trades with dynamic lotsizes based on account balance or some other measure. - Minimum 15-30% growth monthly. - Open to any and all strategies, including advanced stuff like AI/SVM/HMM/etc or moderate/light martingale mechanism - No lower than 5mins timeframe for trading. - EA can
- *Currency Pairs*: Major pairs such as EUR/USD, XAU/USD and GBP/USD - *Funding Currency*: South African Rand (ZAR) - *Initial Deposit*: R100 (may require additional deposit for live trading) - *Risk Management*: Basic risk management features, such as stop loss and take profit - *Strategy*: Pre-defined strategy based on Smart Money Concept principles - *Cost*: Approximately R100-R200 (one-time cost or
I need an Expert advisor based on AOX signal . it must have check and handing of trade operation..errors. The main criterin for opening and dosing a position : moving average direction the price is higher than the previous bar Trade lots is input parameter bar
I have a working strategy for Boom and Crash and need a programmer to build an MT5 Expert Advisor (EA) that trades on the 1-Minute timeframe . Key Requirements: Developer should have at least basic knowledge of Boom and Crash trading. EA must work only on candle ticks for Boom and Crash. The EA will receive trade alerts from my indicator and automatically open trades based on those alerts. No duplicate trades should
Manage my live forex account with a disciplined, low-risk approach that produces steady monthly income. My priority is capital protection, so each trade must be sized conservatively, anchored by firm stop-loss orders, and designed to keep drawdown minimal. High-risk tactics such as martingale, grid systems, or excessive leverage are off the table; a measured, rules-based strategy is essential. I will connect the
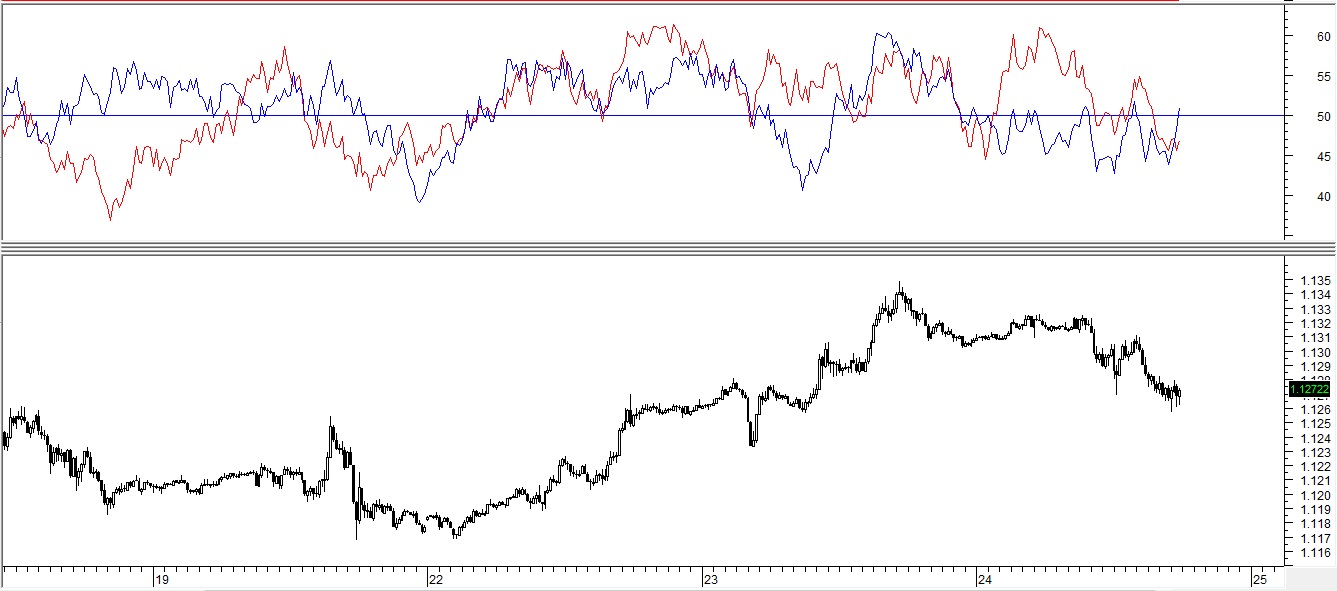
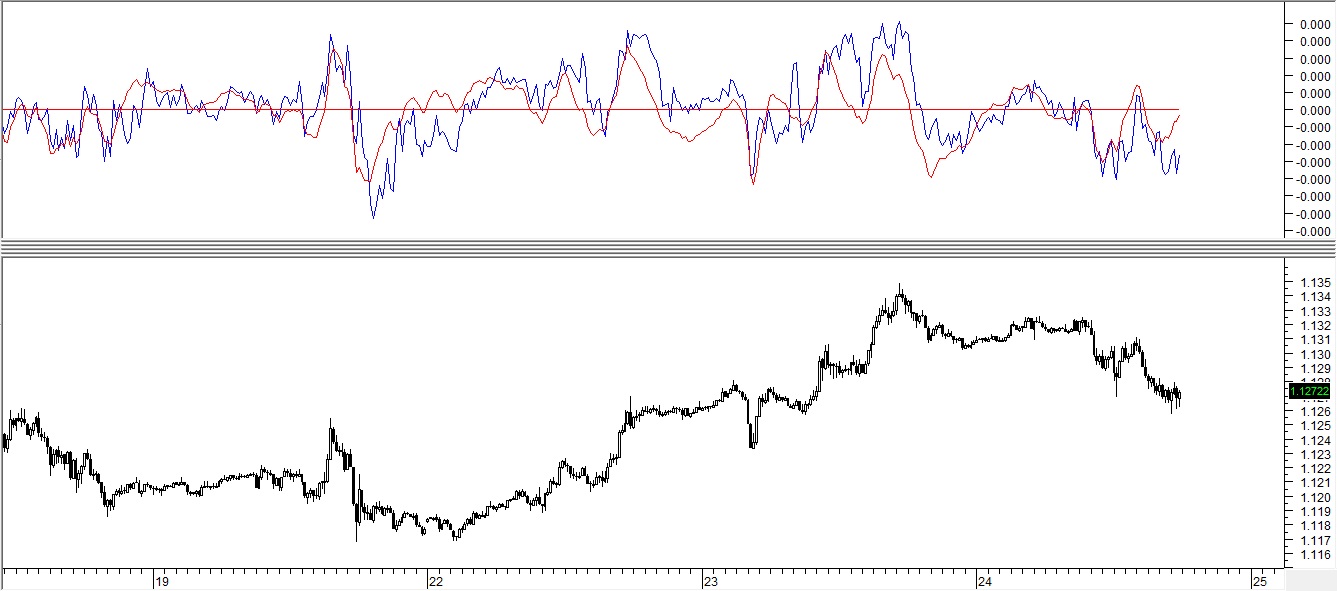
Indicator that finds zones. All details in word document Ask questions if need I’d also like to to change from finding bullish marker and main candles to bearish marker and main candles if price crosses past inputted price The document is showing zones for bullish price action. Id like to also change manually in setting for it to show bearish price action ( it will look for bullish candle markers and main) Zones
I already have an Expert Advisor coded in MQL4, but it refuses to trade anything other than its hard-coded symbol. I want that filter gone so the same strategy can fire on any instrument—forex, indices, metals such as XAUUSD—across any timeframe. The trading logic, money management and inputs must stay exactly as they are; I simply need universal symbol support. After the MT4 file is fixed and compiles cleanly, I
Description: Gildepak is a purchasing cooperative for packaging materials. We need a program to calculate and fairly distribute the annual bonus (received from preferred suppliers) among our member companies (partners and members). The program should work with a set of predefined tables and data flows, and it must be able to import and export Excel files. Main Tables: Member Companies Company ID Company Name Partner