Indicators: AutoGannAutoTrend
So after trying it out, seems like there is an error in the code.
Naively using the times of the zigzag timeframe (don't know what "// Òàéìôðåéì Çèãçàãà äëÿ ðàñ÷åòà èíäèêàòîðà" means) makes the indicator draw the gann lines and such from an incorrect starting and end-point when viewed in a lower timeframe. So for instance if using a daily ZigZag, the gann lines would start from the beginning of the day, even if the price max/min was on a different time of the day. The following snippet block fixes the problem:
...
if(UpSign[bar])
{
swing_value[found]=UpSign[bar];
MqlRates rates[];
int copied=CopyRates(Symbol(),Period(),swing_date[found],swing_date[found]+PeriodSeconds(Timeframe),rates);
if(copied<=0)
Print("Error copying price data ",GetLastError());
for(int i=0; i<copied; i++)
if(rates[i].high==swing_value[found])
{
swing_date[found]=rates[i].time;
break;
}
if(UpSign[bar])
{
swing_value[found]=UpSign[bar];
swing_date[found]=TIME[bar];
{MqlRates rates[];
int copied=CopyRates(Symbol(),Period(),swing_date[found],swing_date[found]+PeriodSeconds(Timeframe),rates);
if(copied<=0)
Print("Error copying price data ",GetLastError());
for(int i=0; i<copied; i++)
if(rates[i].high==swing_value[found])
{
swing_date[found]=rates[i].time;
break;
}
}
found++;
...
And of course a similar snippet on the swing lows, checking if the rates[i].low equals the value.
You are missing trading opportunities:
- Free trading apps
- Over 8,000 signals for copying
- Economic news for exploring financial markets
Registration
Log in
You agree to website policy and terms of use
If you do not have an account, please register
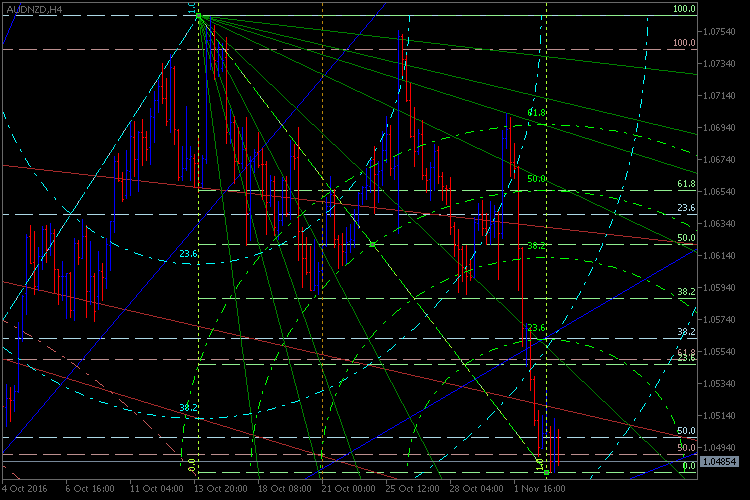
AutoGannAutoTrend:
The indicator plots price channel, Fibonacci levels and Gann fan based on the latest ZigZag peaks.
Author: Nikolay Kositsin