EURUSD Technical Analysis 2016, 17.07 - 24.07: bearish breakdown to be started with 1.1001 support level to be broken
If D1 price breaks 1.1001 support level on close bar so the bearish trend will be continuing up to 1.0911 level to re-enter.
If D1 price breaks 1.1186
resistance level on close bar from below to above so the local uptrend as the bear market rally will be started.
If D1 price will break Senkou Span line at 1.1343 on close bar so the reversal of the price movement to the primary bullish market condition will be started.
If not so the price will be on ranging bearish within the levels.
- Recommendation for long: watch close D1 price to break 1.1186 for possible buy trade
- Recommendation
to go short: watch D1 price to break 1.1001 support level for possible sell trade
- Trading Summary: bearish
| Resistance | Support |
|---|---|
| 1.1186 | 1.1001 |
| 1.1343 | 1.0911 |
SUMMARY : bearish breakdown to be started
New bar was opened today on Monday and the daily price is still within 1.1186/64 - 1.1001 ranging levels waiting for the bear market rally to be started or for the primary bearish trend to be continuing. And 1.1343 is still bullish reversal level, and if the price breaks this level to above so the reversal of the price movement to the primary bullish market condition will be started.

By the way, there are similar levels for H4 intra-day price - the price is located within Ichimoku cloud between the following s/r levels:
- 1.1024 support level located below Ichimoku cloud in the primary bearish area of the chart, and
- 1.1143 resistance level located near and above Ichimoku cloud in the beginning of the primary bullish trend.
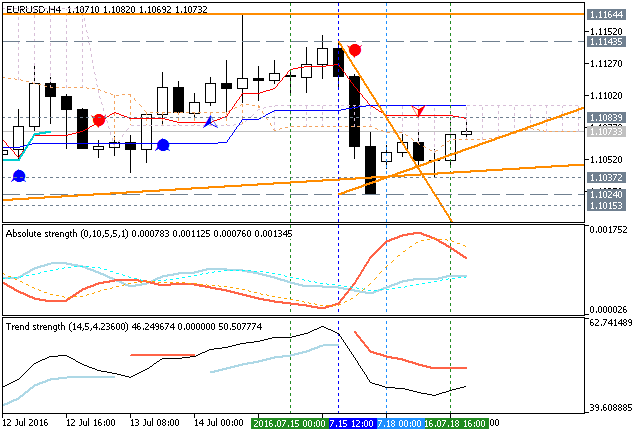
If the price breaks 1.1024 support level to below on H4 close bar so the bearish trend will be continuing up to 1.1001 target to re-enter.
If H4 price breaks 1.1143 resistance to above on close bar so the primary bullish trend will be resumed with 1.1164 bullish target to re-enter.
if not so the price will be on ranging waiting for direction.
Forum on trading, automated trading systems and testing trading strategies
Sergey Golubev, 2016.07.19 13:46
EURUSD Price Action Technical Analysis: ranging around 200-day SMA waiting for direction (adapted from the article)
Daily price is on ranging around 200-day SMA waiting for the direction of the trend to be started. Ascending triangle pattern was formed by the price to be crossed for bullish trend to be resumed.
- "Near-term support is at 1.1018, the 50% Fibonacci expansion, with a break below that on a daily closing basis opening the door for a descent to the 1.0876-1.0912 area (61.8% level, June 24 low). Alternatively, a turn above the 38.2% Fib at 1.1159 paves the way for a retest of trend line support-turned-resistance at 1.1234."
- "Positioning is inconclusive at this point. The dominant trend continues to appear bearish but follow-through is lackluster and prices are too close to support to justify entering short from a risk/reward perspective. Opting for the sidelines seems prudent until something more actionable presents itself."
If D1 price breaks 1.1001
support level on close bar so we may see the primary bearish trend to be started up to 1.0911 level to re-enter.
If D1 price breaks 1.1164
resistance level on close bar from below to above so the primary bullish trend will be resumed.
If not so the price will be on ranging within the levels.

- Recommendation for long: watch close D1 price to break 1.1164 for possible buy trade
- Recommendation
to go short: watch D1 price to break 1.1001 support level for possible sell trade
- Trading Summary: ranging
| Resistance | Support |
|---|---|
| 1.1164 | 1.1001 |
| 1.1426 | 1.0911 |
Forum on trading, automated trading systems and testing trading strategies
Sergey Golubev, 2016.07.21 10:31
Trading News Events: European Central Bank (ECB) Interest Rate Decision (adapted from the article)
2016-07-21 11:45 GMT | [EUR - Minimum Bid Rate]
- past data is 0.00%
- forecast data is 0.00%
- actual data is n/a according to the latest press release
if actual > forecast (or previous one) = good for currency (for EUR in our case)
[EUR - Minimum Bid Rate] = Interest rate on the main refinancing operations that provide the bulk of liquidity to the banking system.
==========
What’s Expected: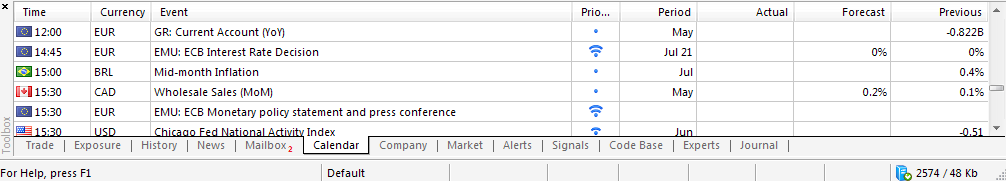
Why Is This Event Important:
"With the U.K.’s imminent exit from the European Union (EU) clouding the
economic outlook for the monetary union, ECB President Mario Draghi may
take additional steps to insulate the euro-area, and the Governing
Council may extend the duration as well as the scope of its quantitative
easing (QE) program in an effort to encourage a stronger recovery."
- "EUR/USD may continue to give back the advance from earlier this year as a
head-and-shoulders formation appears to be playing out in the
second-half of 2016, with a closing price below the Fibonacci overlap
around 1.0960 (23.6% retracement) to 1.0970 (38.2% retracement) opening
up the next downside target around 1.0910 (38.2% expansion)."
- Key Resistance: "1.1760 (61.8% retracement) to 1.1810 (38.2% retracement)."
- Key Support: "Interim Support: 1.0380 (78.6% expansion) to 1.0410 (61.8% expansion)."
- Bearish trade: "Need red, five-minute candle following the policy statement to consider a short EUR/USD trade."
- Bullish trade: "Need green, five-minute candle to favor a long EUR/USD trade."
==========
EUR/USD H1: ranging inside Ichimoku cloud for direction. The price is located inside Ichimoku cloud for the ranging condition within the following key reversal support/resistance levels:
- 1.1006 support level located below Ichimoku cloud and near Senkou Span line in the beginning of the bearish trend to be resumed, and
- 1.1046 resistance level located in the beginning of the bullish trend to be started.
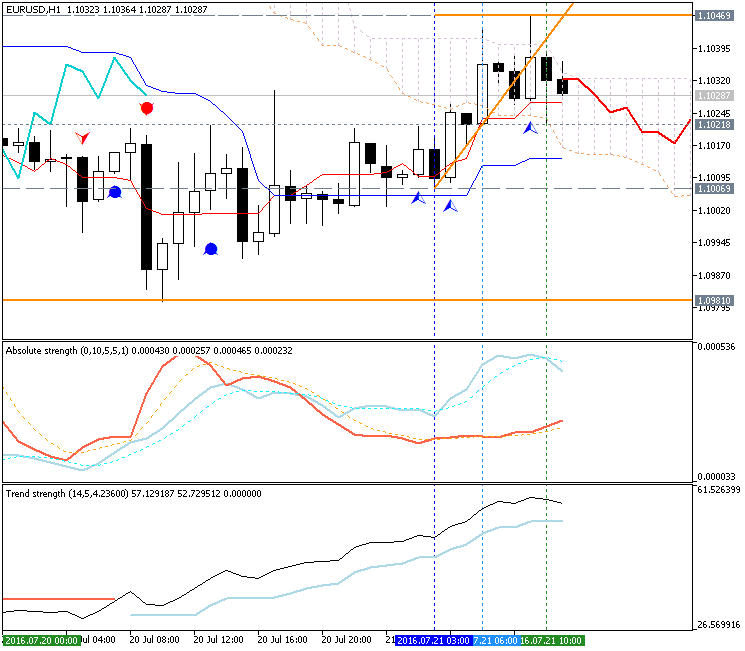
If the price breaks 1.1046 resistance to above on close H1 bar so the bullish reversal will be started.
If not so the price will be continuing with the ranging within the levels.
| Resistance | Support |
|---|---|
| 1.1046 | 1.1006 |
| N/A | 1.0981 |
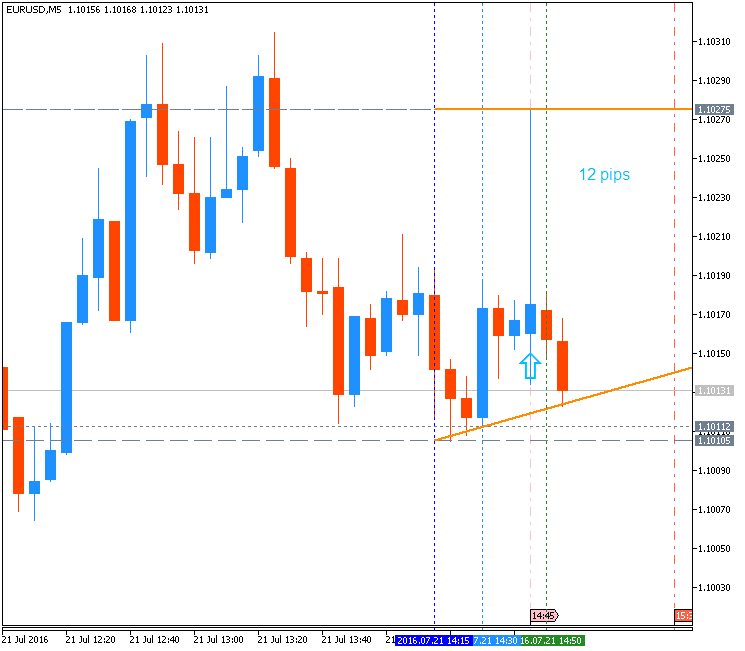
EUR/USD M5: 12 pips price movement by European Central Bank (ECB) Interest Rate news event
Forum on trading, automated trading systems and testing trading strategies
Sergey Golubev, 2016.07.21 14:46
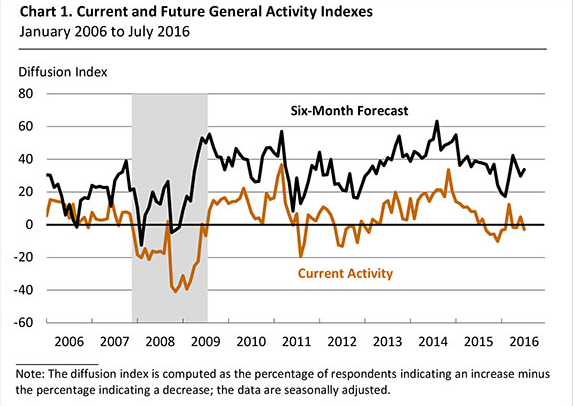
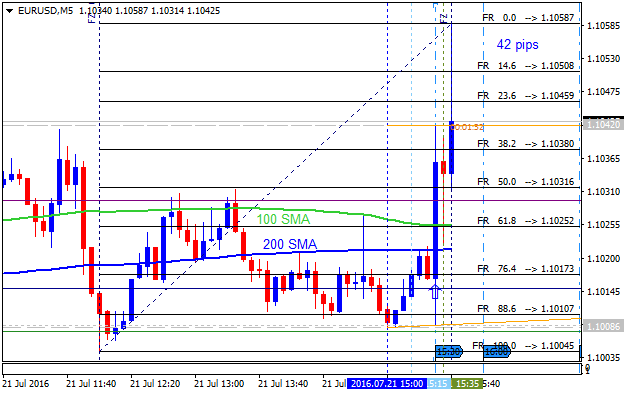
EUR/USD Intra-Day Fundamentals: Philadelphia Fed Business Outlook Survey and and 42 pips price movement
2016-07-21 12:30 GMT | [USD - Philly Fed Manufacturing Index]
- past data is 4.7
- forecast data is 4.5
- actual data is -2.9 according to the latest press release
if actual > forecast (or previous one) = good for currency (for USD in our case)
[USD - Philly Fed Manufacturing Index] = Level of a diffusion index based on surveyed manufacturers in Philadelphia.
==========
"The survey’s broadest measure of manufacturing conditions, the diffusion index of current activity, fell from 4.7 in June to -2.9 this month. For nine of the past 11 months, this diffusion index has been negative (see Chart 1). Twenty-two percent of the firms reported an increase in activity, 3 points lower than last month, and the percent of firms that reported decreases rose from 20 to 25. Fifty-one percent of the firms reported steady activity this month, similar to the share that reported steady activity last month."
==========
EUR/USD M5: 42 pips price movement by Philadelphia Fed Business Outlook Survey news event
Forum on trading, automated trading systems and testing trading strategies
Sergey Golubev, 2016.07.22 10:51
Technical Targets for EUR/USD by United Overseas Bank (based on the article)
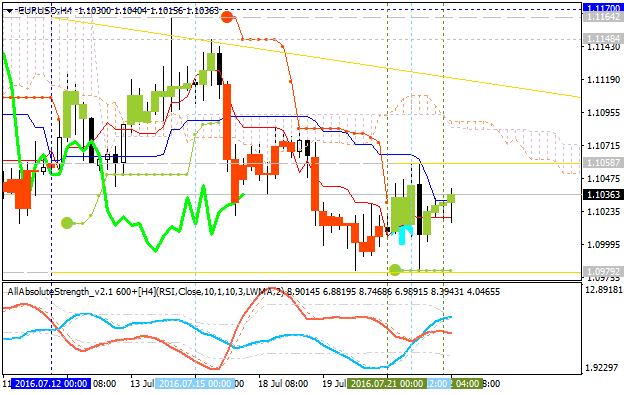
H4 price
is located below Ichimoku in the primary bearish area of the chart:
price is on ranging within the following narrow support/resistance
levels:
- 1.1058 resistance level located near Senkou Span line in the beginnign of the primary bullish trend to be started, and
- 1.0979 support level located far below Ichimoku cloud in the bearish area of the chart.
Absolute Strength indicator together with Chinkou Span line are estimating the bear market rally to be started on the secondary ranging way.
Daily
price. United Overseas Bank is considering for EUR/USD for the bearish market condition to be continuing with 1.0905/10 and 1.0820 levels as a possible daily target:
"While downward momentum has improved, only a daily closing below 1.1095 would indicate that a move towards 1.0905/10, 1.0820 has started. This scenario still seems likely unless EUR can move back above 1.1120 from here (1.1060 is already a strong short-term resistance)."
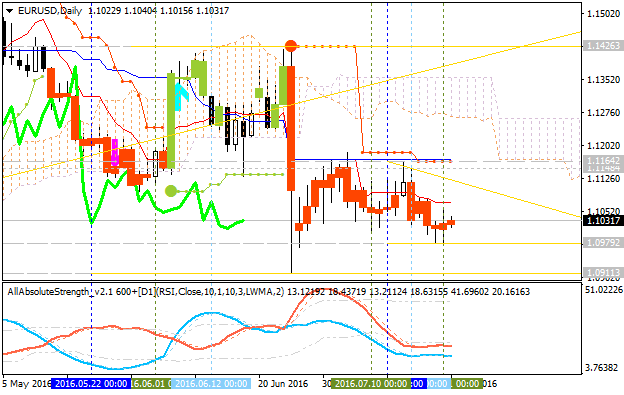
- If daily price breaks 1.1164 resistance level
on close bar so the bullish reversal will be started.
- If daily price breaks 1.0979 support level on close bar so the primary bearish trend will be continuing up to 1.0911 bearish target to re-enter.
- If not so the price will be ranging within the levels.
- Free trading apps
- Over 8,000 signals for copying
- Economic news for exploring financial markets
You agree to website policy and terms of use
Daily price is on bearish breakdown to be started on open D1 bar for now: the price is testing 1.1001 support level to below for the bearish breakdown to be continuing.
If D1 price breaks 1.1001 support level on close bar so the bearish trend will be continuing up to 1.0911 level to re-enter.
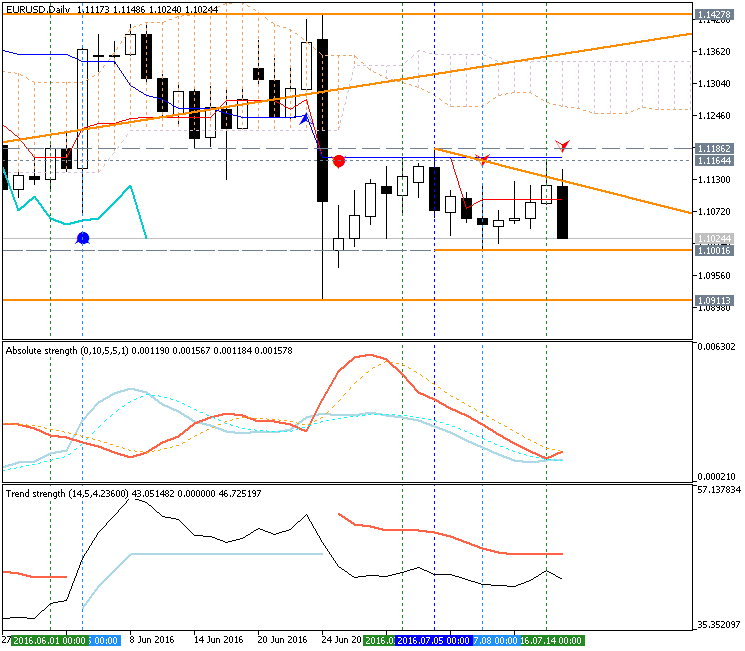
If D1 price breaks 1.1186 resistance level on close bar from below to above so the local uptrend as the bear market rally will be started.
If D1 price will break Senkou Span line at 1.1343 on close bar so the reversal of the price movement to the primary bullish market condition will be started.
If not so the price will be on ranging bearish within the levels.
SUMMARY : bearish breakdown to be started
TREND : bearish