Where to get these value ?
//+------------------------------------------------------------------+
//|                                                   DiverStoch.mq4 |
//|                                                            ViDan |
//|                                                vi_dancom@mail.ru |
//+------------------------------------------------------------------+
#property copyright "ViDan"
#property link      "vi_dancom@mail.ru"

#property indicator_separate_window
#property indicator_buffers 4
#property indicator_color1 Blue
#property indicator_color2 Green
#property indicator_color3 Red
#property indicator_width1 1
#property indicator_width2 2
#property indicator_width3 2
//---- input parameters
//Для стохастика
extern int KPeriod = 5;
extern int DPeriod = 3;
extern int Slowing = 3;
extern bool DrawPriceLines=false;
extern bool DrawArrows=true;
extern bool      drawDivergenceLines=true;
extern bool      displayAlert=false;
//---- buffers
double StochLineBuffer[];
double bullishDivergence[];
double bearishDivergence[];
double StochDiv[];

string indicatorName;
//----
static datetime lastAlertTime;
//+------------------------------------------------------------------+
//| Custom indicator initialization function                         |
//+------------------------------------------------------------------+
int init()
  {
//---- indicators
   SetIndexStyle(0,DRAW_LINE,STYLE_SOLID,0);
   SetIndexStyle(1,DRAW_ARROW,STYLE_SOLID,0);
   SetIndexStyle(2,DRAW_ARROW,STYLE_SOLID,0);
   SetIndexStyle(3,DRAW_NONE);
//----
   SetIndexBuffer(0,StochLineBuffer);
   SetIndexBuffer(1,bullishDivergence);
   SetIndexBuffer(2,bearishDivergence);
   SetIndexBuffer(3,StochDiv);
//----
   SetIndexArrow(1,233);
   SetIndexArrow(2,234);
//----
   IndicatorDigits(Digits+2);
   indicatorName=("Stoch("+KPeriod+","+DPeriod+","+Slowing+")");
//IndicatorShortName("StochLineBuffer_Div(" + MomPeriod + ")");
   return(0);
  }
//+------------------------------------------------------------------+
//| Custom indicator deinitialization function                       |
//+------------------------------------------------------------------+
int deinit()
  {
   for(int i=ObjectsTotal()-1; i>=0; i--)
     {
      string label=ObjectName(i);
      if(StringSubstr(label,0,14)!="DivergenceLine")
         continue;
      ObjectDelete(label);
     }
   return(0);
  }
//+------------------------------------------------------------------+
//| Custom indicator iteration function                              |
//+------------------------------------------------------------------+
int start()
  {
   int counted_bars=IndicatorCounted();
   if(counted_bars<0) return(-1);
   if(counted_bars>0) counted_bars--;
   int limit=Bars-counted_bars;
   if(counted_bars==0) limit-=1+MathMax(KPeriod,DPeriod);

   CalculateIndicator(limit);
   return(0);
  }
//+------------------------------------------------------------------+
//|                                                                  |
//+------------------------------------------------------------------+
void CalculateIndicator(int countedBars)
  {
   for(int i=countedBars; i>=0; i--)
     {
      CalculateStochDiv(i);
      CatchBullishDivergence(i+2,countedBars);
      CatchBearishDivergence(i+2,countedBars);
     }
  }
//+------------------------------------------------------------------+
//|                                                                  |
//+------------------------------------------------------------------+
void CalculateStochDiv(int i)
  {
   StochLineBuffer[i]=iStochastic(Symbol(),0,KPeriod,DPeriod,Slowing,MODE_SMA,0,MODE_MAIN,i);
   StochDiv[i]=StochLineBuffer[i];
  }
//+------------------------------------------------------------------+
//|                                                                  |
//+------------------------------------------------------------------+
void CatchBullishDivergence(int shift,int maxind)
  {
   if(IsIndicatorTrough(shift)==false)
      return;
   int currentTrough=shift;
   int lastTrough=GetIndicatorLastTrough(shift,maxind);

   if(currentTrough==-1) return;
   if(lastTrough==-1) return;

   if(StochDiv[currentTrough]>StochDiv[lastTrough] && Low[currentTrough]<Low[lastTrough])
     {
      bullishDivergence[currentTrough]=StochDiv[currentTrough];
      if(drawDivergenceLines==true)
        {
         DrawPriceTrendLine(Time[currentTrough],Time[lastTrough],Low[currentTrough],
                            Low[lastTrough],Green,STYLE_SOLID);
         DrawIndicatorTrendLine(Time[currentTrough],Time[lastTrough],StochDiv[currentTrough],
                                StochDiv[lastTrough],Green,STYLE_SOLID,drawDivergenceLines);
        }
      if(displayAlert==true)
         DisplayAlert("Classical bullish divergence on: ",currentTrough);
     }
   if(StochDiv[currentTrough]<StochDiv[lastTrough] && Low[currentTrough]>Low[lastTrough])
     {
      bullishDivergence[currentTrough]=StochDiv[currentTrough];
      if(drawDivergenceLines==true)
        {
         DrawPriceTrendLine(Time[currentTrough],Time[lastTrough],Low[currentTrough],
                            Low[lastTrough],Green,STYLE_DOT);
         DrawIndicatorTrendLine(Time[currentTrough],Time[lastTrough],StochDiv[currentTrough],
                                StochDiv[lastTrough],Green,STYLE_DOT,drawDivergenceLines);
        }
      if(displayAlert==true)
         DisplayAlert("Reverse bullish divergence on: ",currentTrough);
     }
  }
//+------------------------------------------------------------------+
//|                                                                  |
//+------------------------------------------------------------------+
void CatchBearishDivergence(int shift,int maxind)
  {
   if(IsIndicatorPeak(shift)==false)
      return;
   int currentPeak=shift;
   int lastPeak=GetIndicatorLastPeak(shift,maxind);

   if(currentPeak==-1) return;
   if(lastPeak==-1) return;

   if(StochDiv[currentPeak]<StochDiv[lastPeak] && High[currentPeak]>High[lastPeak])
     {
      bearishDivergence[currentPeak]=StochDiv[currentPeak];
      if(drawDivergenceLines==true)
        {
         DrawPriceTrendLine(Time[currentPeak],Time[lastPeak],High[currentPeak],
                            High[lastPeak],Red,STYLE_SOLID);
         DrawIndicatorTrendLine(Time[currentPeak],Time[lastPeak],StochDiv[currentPeak],
                                StochDiv[lastPeak],Red,STYLE_SOLID,drawDivergenceLines);
        }
      if(displayAlert==true)
         DisplayAlert("Classical bearish divergence on: ",currentPeak);
     }
   if(StochDiv[currentPeak]>StochDiv[lastPeak] && High[currentPeak]<High[lastPeak])
     {
      bearishDivergence[currentPeak]=StochDiv[currentPeak];
      if(drawDivergenceLines==true)
        {
         DrawPriceTrendLine(Time[currentPeak],Time[lastPeak],High[currentPeak],
                            High[lastPeak],Red,STYLE_DOT);
         DrawIndicatorTrendLine(Time[currentPeak],Time[lastPeak],StochDiv[currentPeak],
                                StochDiv[lastPeak],Red,STYLE_DOT,drawDivergenceLines);
        }
      if(displayAlert==true)
         DisplayAlert("Reverse bearish divergence on: ",currentPeak);
     }
  }
//+------------------------------------------------------------------+
//|                                                                  |
//+------------------------------------------------------------------+
bool IsIndicatorPeak(int shift)
  {
   if(StochDiv[shift]>=StochDiv[shift+1] && StochDiv[shift]>StochDiv[shift+2] &&
      StochDiv[shift]>StochDiv[shift-1])
      return(true);
   else
      return(false);
  }
//+------------------------------------------------------------------+
//|                                                                  |
//+------------------------------------------------------------------+
bool IsIndicatorTrough(int shift)
  {
   if(StochDiv[shift]<=StochDiv[shift+1] && StochDiv[shift]<StochDiv[shift+2] &&
      StochDiv[shift]<StochDiv[shift-1])
      return(true);
   else
      return(false);
  }
//+------------------------------------------------------------------+
//|                                                                  |
//+------------------------------------------------------------------+
int GetIndicatorLastPeak(int shift,int maxind)
  {
   for(int i=shift+5; i<maxind-2; i++)
     {
      if(StochLineBuffer[i] >= StochLineBuffer[i+1] && StochLineBuffer[i] >= StochLineBuffer[i+2] &&
         StochLineBuffer[i] >= StochLineBuffer[i-1] && StochLineBuffer[i] >= StochLineBuffer[i-2])
        {
         for(int j=i; j<maxind-2; j++)
           {
            if(StochDiv[j] >= StochDiv[j+1] && StochDiv[j] > StochDiv[j+2] &&
               StochDiv[j] >= StochDiv[j-1] && StochDiv[j] > StochLineBuffer[j-2])
               return(j);
           }
        }
     }
   return(-1);
  }
//+------------------------------------------------------------------+
//|                                                                  |
//+------------------------------------------------------------------+
int GetIndicatorLastTrough(int shift,int maxind)
  {
   for(int i=shift+5; i<maxind-2; i++)
     {
      if(StochLineBuffer[i] <= StochLineBuffer[i+1] && StochLineBuffer[i] <= StochLineBuffer[i+2] &&
         StochLineBuffer[i] <= StochLineBuffer[i-1] && StochLineBuffer[i] <= StochLineBuffer[i-2])
        {
         for(int j=i; j<maxind-2; j++)
           {
            if(StochDiv[j] <= StochDiv[j+1] && StochDiv[j] < StochDiv[j+2] &&
               StochDiv[j] <= StochDiv[j-1] && StochDiv[j] < StochDiv[j-2])
               return(j);
           }
        }
     }
   return(-1);
  }
//+------------------------------------------------------------------+
//|                                                                  |
//+------------------------------------------------------------------+
void DisplayAlert(string message,int shift)
  {
   if(shift<=2 && Time[shift]!=lastAlertTime)
     {
      lastAlertTime=Time[shift];
      Alert(message,Symbol()," , ",Period()," minutes chart");
     }
  }
//+------------------------------------------------------------------+
//|                                                                  |
//+------------------------------------------------------------------+
void DrawPriceTrendLine(datetime x1,datetime x2,double y1,
                        double y2,color lineColor,double style)
  {
   string label="DivergenceLine2.1# "+DoubleToStr(x1,0);
   ObjectDelete(label);
   ObjectCreate(label,OBJ_TREND,0,x1,y1,x2,y2,0,0);
   ObjectSet(label,OBJPROP_RAY,0);
   ObjectSet(label,OBJPROP_COLOR,lineColor);
   ObjectSet(label,OBJPROP_STYLE,style);
  }
//+------------------------------------------------------------------+
//|                                                                  |
//+------------------------------------------------------------------+
void DrawIndicatorTrendLine(datetime x1,datetime x2,double y1,
                            double y2,color lineColor,double style,bool bullishDivergence)
  {
   int indicatorWindow=WindowFind(indicatorName);
   if(indicatorWindow<0) return;

   string label="Stoch_DivergenceLine - "+DoubleToStr(x1,0);
   string labelArrow="StochD"+DoubleToStr(x1,0)+"-"+DoubleToStr(y1,0);
   ObjectDelete(label);
   ObjectDelete(labelArrow);
   ObjectCreate(label,OBJ_TREND,indicatorWindow,x1,y1,x2,y2,
                0,0);
   ObjectSet(label,OBJPROP_RAY,0);
   ObjectSet(label,OBJPROP_COLOR,lineColor);
   ObjectSet(label,OBJPROP_STYLE,style);
   if(DrawArrows)
     {
      if(bullishDivergence)
        {
         ObjectCreate(labelArrow,OBJ_ARROW,indicatorWindow,x1,y1-1,0,0);
         ObjectSet(labelArrow,OBJPROP_COLOR,lineColor);
         ObjectSet(labelArrow,OBJPROP_ARROWCODE,SYMBOL_ARROWUP);
        }
      else
        {
         ObjectCreate(labelArrow,OBJ_ARROW,indicatorWindow,x1,y1+11);
         ObjectSet(labelArrow,OBJPROP_COLOR,lineColor);
         ObjectSet(labelArrow,OBJPROP_ARROWCODE,SYMBOL_ARROWDOWN);
        }
     }

  }
//+------------------------------------------------------------------+
in the code, which part is showing those value ?
//----
   IndicatorDigits(Digits+2);
   indicatorName=("Stoch("+KPeriod+","+DPeriod+","+Slowing+")");
//IndicatorShortName("StochLineBuffer_Div(" + MomPeriod + ")");
   return(0);
this is showing Stoch(5, 3, 3)
and what about the last number ?
how to get it and where ?
thanks for any help.
this is showing Stoch(5, 3, 3)
and what about the last number ?
how to get it and where ?
thanks for any help.
Values displayed after the indicator name should be current values of the indicator buffers.
Turn on the "Data Window" (from the "View" menu or press ctrl+D), move mouse over the newest candle and compare the values.
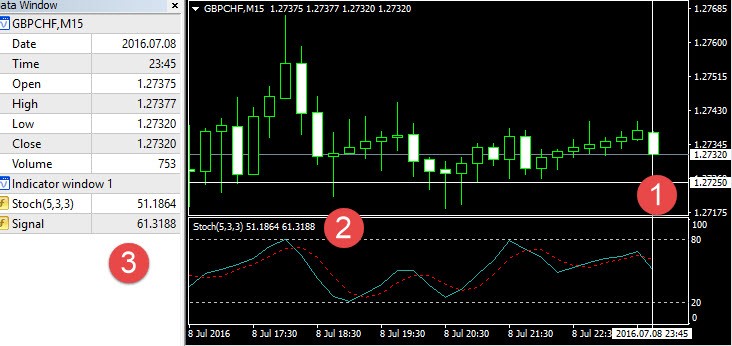
1 - mouse cursor is over the last candle
2 & 3 current values in the indicator window are same as buffer values in the "Data Window"
For the custom indicators, use the iCustom() function to get buffer values.
For the built-in indicators, check the corresponding docs.

- docs.mql4.com
- Free trading apps
- Over 8,000 signals for copying
- Economic news for exploring financial markets
You agree to website policy and terms of use
https://www.mql5.com/en/code/8655