USD/CAD Technical Analysis 2016, 10.07 - 17.07: daily ranging within 100 SMA/200 SMA area
Forum on trading, automated trading systems and testing trading strategies
Sergey Golubev, 2016.07.09 12:22
Credit Agricole with Week Ahead: Relative Value Trades With Degrees of Separation From The Brexit Trade (adapted from the article)
Credit Agricole was analysiing the Brexit situation onto the forex price movement with the taking into account the pairs with the good degrees of the separation from the Brexit trade for example:
- "Our preference still is for relative value trades like long AUD/NZD."
- "We stick with our long USD/CAD call as we maintain our constructive view on USD overall especially against G10 commodity currencies."
- "The outcome of the Upper House elections in Japan may increase the chances of structural reforms and add to investors bets on further BoJ easing. At the margin, this could help weaken the JPY."
Let's describe the situation with the technical points of view.
USD/CAD - Next Week Forecast. Credit Agricole forecasted for the price to be in long for the coming week. As we see form the chart below - the price is on bullish market condition by Ichimoku cloud to be broken to above with 1.3055 resistance to be tested for the bullish trend to be continuing. Chinkou Span line is located near and below the price to be ready for the possible bullish breakout, and Trend Strength indicator together with Absolute Strength indicator are estimating the bullish trend to be continuing. Alternative, the breaking 1.2831 support level to below will lead to the bearish reversal to be started up to 1.2654 bearish target in this case for example.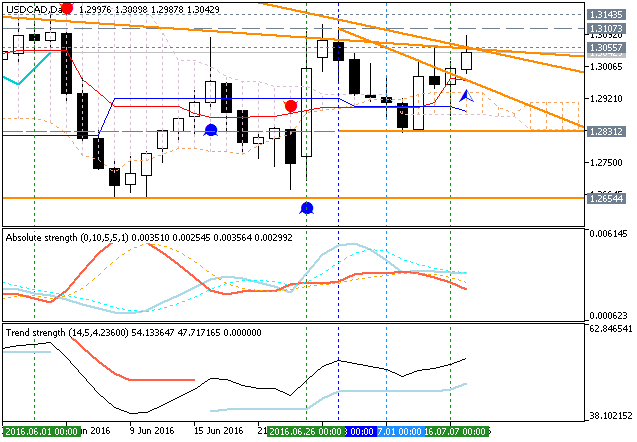
Most likely scenarios for the daily price are the following: bullish breakout will be continuing or the ranging within the bullish will be started.
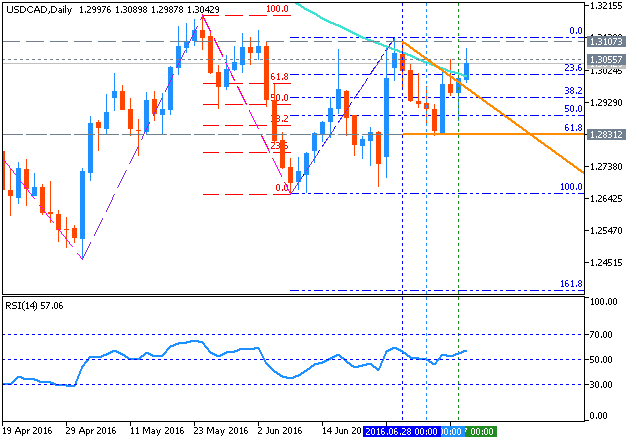
Daily price is located below 200 SMA in the bearish area of the chart: the price is on ranging within Fibo resistance level at 1.3120 and 61.8% Fibo support level at 1.2831.
- If the price will break 1.3120 resistance level so the local uptrend as the bear market rally will be started with the good possibility to the reversal of the price movement to the primary bullish market condition.
- If price will break 1.2831 support so the bearish trend will be continuing.
- If not so the price will be ranging within the levels.
| Resistance | Support |
|---|---|
| 1.3120 | 1.2831 |
| N/A | 1.2656 |
- Recommendation to go short: watch the price to break 1.2831 support level for possible sell trade
- Recommendation to go long: watch the price to break 1.3120 resistance level for possible buy trade
- Trading Summary: ranging
SUMMARY : ranging
Daily price broke 1.3120 together with 100 SMA to above for the ranging bearish market condition. The local uptrend as the secondary rally was started for the price in the ranging way: the price is located below 200 SMA and within 100 SMA/200 SMA area with 1.3139 resistance level to be tested for the bear market rally to be continuing.
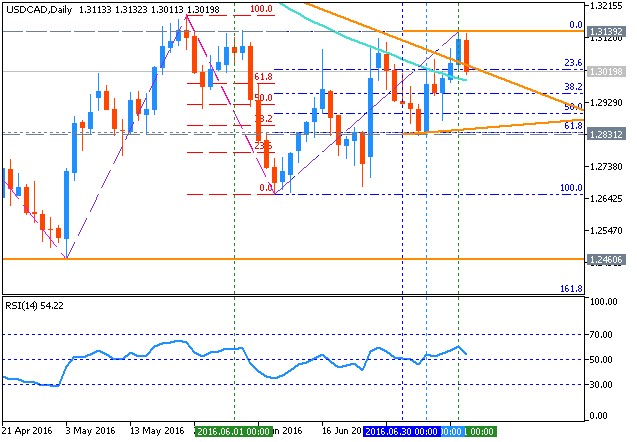
Bearish continuation level is 1.2831 which remains from the previous week, and it means the following: if the price breaks this level to below on daily close bar so the pruimary bearish trend will be continuing.
There are new key level for the daily price for now: 1.3300, and this is the level of 200 SMA on the daily chart. If the price breaks this level to above so the reversal of the daily price movement from the bearish to the primary bullish market condition will be started.
Anyway, the most likely scenario for this week is the following: the price will be on the bearish ranging within 1.33/128 levels.
USDCAD is bullish in long term.
the stop loss is at 1.28200.
it is better buying steply.
be succeed.
It depends on the timeframe fo the chart, for example:
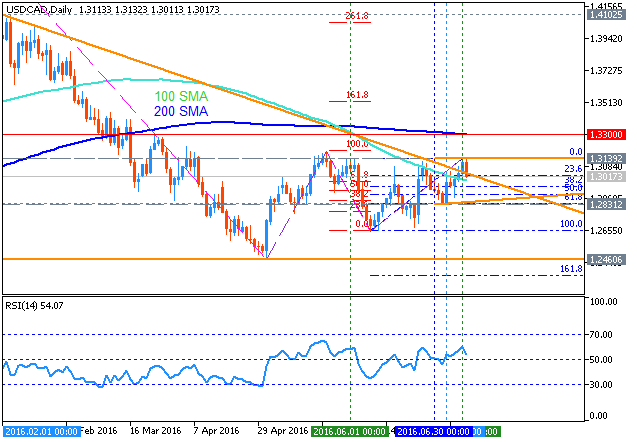
- The long-term situation - monthly chart: the price is located above 200 SMA/100 SMA for the bullish but the monthly price is traded near 200 SMA bearish reversal so everything is possible in long-term situation. Anyway, the price was started with the bullish trend in the beginning of January last year.
- The medium-term situation - weekly chart: the price is located far above 200 SMA and near above 100 SMA so we may have two scenarios for the movement in the medium term situation (within the period of the several months for example): the bullish trend will be continuing by 1.3139 resistance level to be broken, or the secondary correction will be started in the fully eranging way (in case the price breaks 1.2460 support ot below on weekly close bar).
- The short-term situation - daily chart: the price is already on the ranging condition within 100 SMA/200 SMA area waiting for the direction: for the primary bearish trend to be continuing, or to the daily bullish reversal.
So, if we look at whole the situation for those 3 timeframes - the most likely scenario for this pair is the ranging.
USDCAD trend is in bullish mode in every chart.daily-weekly-monthly.
as EURCAD is in bullish trend.
Charts do not lie.
they are going to break a daily resistance.
however it happend for EURCAD.
Charts speak together and conform together exactly like USDCAD & EURCAD.
I experienced this market more than 10 years.
trust my experience.
There are two dominant themes that it is important to understand when
analyzing the Canadian Dollar from a fundamental standpoint. The first,
as its designation as a commodity currency implies, is the fact that
exports of natural resources (especially gold and oil) make up a
significant part of the Canadian economy. This is important to
understand because as Canada is the world's 14th largest producer of oil
and 5th largest producer of gold, the price of these and other
commodities normally has a direct affect on the Canadian Dollar's
Exchange rate.
The second thing that it is important to understand here, is the fact
that as the Canadian population is relatively small in comparison to its
land mass, the economy is heavily reliant on exports, which ties the
country more closely together with the international economy as a whole.
This is particularly true in regards to economy of the United States,
as the US is Canada's largest trading partner, and 81% of Canadian
Exports flow to the US.
While many people believe that the US relies most heavily on the middle
east for its oil imports, it is actually Canada that is the largest
supplier of oil to the United States. As the US is the world's largest
oil consumer and Canada is one of the largest producers, fluctuations in
the price of oil have double the impact. As we learned in our lesson
on trade flows, as the US is a net oil importer and Canada is a net oil
exporter, then all else being equal, a rise in the price of oil should
strengthen the CAD and weaken the USD.
While exports of commodities are still a very important component of the Canadian economy, the country's service sector has experienced massive growth in recent decades, to the point where the service industry now accounts for 2/3rds of the country's economic output. This is important to understand because, as the United States is its largest trading partner, a slowdown in the US Economy can hurt the Canadian economy and its currency, even if commodity prices remain high.
Forum on trading, automated trading systems and testing trading strategies
Sergey Golubev, 2016.07.13 16:21
USD/CAD Intra-Day Fundamentals: Bank of Canada Overnight Rate, BoC Monetary Policy Report and 101 pips price movement
2016-07-13 14:00 GMT | [CAD - Overnight Rate]
- past data is 0.50%
- forecast data is 0.50%
- actual data is 0.50% according to the latest press release
if actual > forecast (or previous one) = good for currency (for CNY in our case)
[CAD - Overnight Rate] = Interest rate at which major financial institutions borrow and lend overnight funds between themselves.
==========
==========
USD/CAD M5: 101 pips price movement by Bank of Canada Overnight Rate news event :
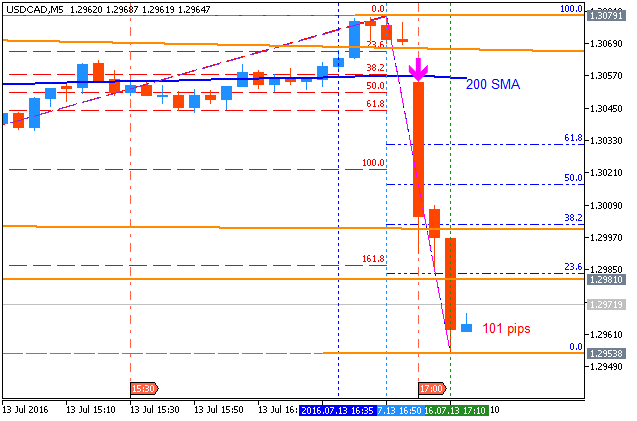
M5 price crossed 200 SMA to below for the bearish reversal: the price broke support level by the bearish breakdown and it was bounced from 1.2953 support level for the ranging to be started. If the price breaks 1.2953 level to below so the bearish breakdown will be continuing with the new bottom to be forming, if not so the price will be on the bearish ranging within the levels.
- Free trading apps
- Over 8,000 signals for copying
- Economic news for exploring financial markets
You agree to website policy and terms of use
Daily price is located below 200 SMA in the bearish area of the chart: the price is on ranging within Fibo resistance level at 1.3120 and 61.8% Fibo support level at 1.2831.
SUMMARY : ranging
TREND : berish