Indicators: Ichimoku Kinko Hyo
newdigital, 2013.11.22 19:06
Breakout with Ichimoku (based on Take Advantage of False Breakouts at Great Prices with Ichimoku article)
Talking Points:
- What is a False Breakout?
- How Ichimoku Can Help You Recognize a False Breakout
- Trading Opportunity in EURUSD with Ichimoku on Recent Move
What is a False Breakout?
A false breakout takes place when price appears to be making a renewed move in the direction of the trend only to be retraced. A trend trader who is looking for prices to eventually move higher but wants confirmation of a price thrust in the direction of the trend is especially prey to false breakouts. This is because a break of resistance like a trendline that is pierced by price without follow through is ground zero to a false breakout.
How Ichimoku Helps You Recognize a False Breakout
Like many pains of trading such as stops getting hit at an unfortunate price, false breakouts cannot be avoided. However, they can be minimized as well as become a nice trading signal upon their failure. The reason I like looking to false breakouts as a trading opportunities is that they can often have a sharp reversal in the direction of the prior move with a good risk to reward ratio.
Ichimoku is a technical trading system that helps you catch moves in the direction of the trend on the time frame that you’re trading. Ichimoku is often seen as a difficult system to learn due to the 5 components that are displayed on the chart to explain a trading opportunity but each line serves a purpose and when you understand each purpose, you begin to get a feel for the value that Ichimoku can bring to your technical trading strategy.
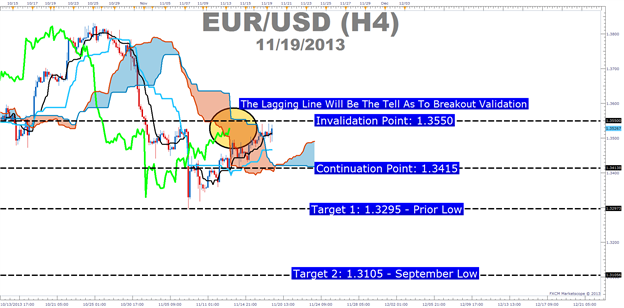
- Ichimoku Trade: Sell EURUSD If Price Breaks Below 1.3415 Showing a False Breakout Occurred
- Stop: 1.3550 (Technical Invalidation Point on the Chart)
- Limit: 1.3295 (Monthly Low)
If this is your first reading of the Ichimoku report, here is a recap of the traditional rules for a sell trade:
- Price is below the Kumo Cloud (That will be our entry trigger)
- The trigger line (black) is below the base line (light blue) or is crossing below
- Lagging line is below price action from 26 periods ago (bright green line)
- Kumo ahead of price is bearish and falling (red cloud = bearish Kumo)
If the breakout turns out to be legitimate and 1.3550 is taken out, then the next target would be in the neighborhood of 1.3630 /3650 range.
newdigital, 2013.11.25 12:23
Ichimoku Cloud (based on The Definitive Guide to Trading Trends with Ichimoku Cloud article)
Many traders are asked what indicator they would wish to never do without. The answer has never wavered as there is one indicator that clearly illustrates the current trend, helps you time entries, displays support and resistance, clarifies momentum, and shows you when a trend has likely reversed. That indicator is Ichimoku Kinko Hyo or more casually known as Ichimoku.
Ichimoku is a technical or chart indicator that is also a trend trading system in and of itself. The creator of the indicator, Goichi Hosada, introduced Ichimoku as a “one glance” indicator so that in a few seconds you are able to determine whether a tradable trend is present or if you should wait for a better set-up on a specific pair.
Before we break down the components of the indicator in a clear and relatable manner, there are a few helpful things to understand. Ichimoku can be used in both rising and falling markets and can be used in all time frames for any liquid trading instrument. The only time to not use Ichimoku is when no clear trend is present.
Always Start With the Cloud
The cloud is composed of two dynamic lines that are meant to serve multiple functions. However, the primary purpose of the cloud is to help you identify the trend of current price in relation to past price action. Given that protecting your capital is the main battle every trader must face, the cloud helps you to place stops and recognize when you should be bullish or bearish. Many traders will focus on candlesticks or price action analysis around the cloud to see if a decisive reversal or continuation pattern is taking shape.
In the simplest terms, traders who utilize Ichimoku should look for buying entries when price is above the cloud. When price is below the cloud, traders should be looking for temporary corrections higher to enter a sell order in the direction of the trend. The cloud is the cornerstone of all Ichimoku analysis and as such it is the most vital aspect to the indicator.
Time Entries with the Trigger & Base Line
Once you have built a bias of whether to look for buy or sell signals with the cloud, you can then turn to the two unique moving averages provided by Ichimoku. The fast moving average is a 9 period moving average and the slow moving average is a 26 period moving average by default. What is unique about these moving averages is that unlike their western counterparts, the calculation is built on mid-prices as opposed to closing prices. I often refer to the fast moving average as the trigger line and the slow moving average as the base line.
The Ichimoku components are introduced in a specific order because that is how you should analyze or trade the market. Once you’ve confirmed the trend by recognizing price as being below or above the cloud, you can move to the moving averages. If price is above the cloud and the trigger crosses above the base line you have the makings of a buy signal. If price is below the cloud and the trigger crosses below the base line you have the makings of a sell signal.
Confirm Entries with the Mysterious Lagging Line
In addition to the mystery of the cloud, the lagging line often confuses traders. This shouldn’t be the case as it’s a very simple line that is the close of the current candle pushed back 26 periods. When studying Ichimoku, I found that this line was considered by most traditional Japanese traders who utilize mainly Ichimoku as one of the most important components of the indicator.
Once price has broken above or below the cloud and the trigger line is crossing the base line with the trend, you can look to the lagging line as confirmation. The lagging line can best confirm the trade by breaking either above the cloud in a new uptrend or below the cloud in a developing downtrend. Looking above, you can see that the trend often gathers steam nicely after the lagging line breaks through the cloud. Another benefit of using the lagging line as a confirmation indicator is that the lagging line can build patience and discipline in your trading because you won’t be chasing the initial thrust but rather waiting for the correction to play out before entering in the direction of the overall trend.
Trading With Ichimoku Checklist
Now that you know the components of Ichimoku here is a checklist that you can print off or use to keep the main components of this dynamic trend following system:
Ichimoku Checklist:
1.Where is Price in Relation to the Cloud?
- Above the cloud -filtered for buy only signals
- In the Cloud - be cautious but ready to jump in on the prior trend or finesse a current position. what the candle stick formations heavily
- Below the cloud - filtered for short only trades
2. Is price consistently on one side of the cloud or is price whipping around on both sides consistently?
- Ichimoku is best used with clear trends and should be set aside during ranging markets.
3. Which level of the Ichimoku would like to use to place your stop?
- If you use Ichimoku to place stops as well, you can either use the cloud or the base line.
Forum on trading, automated trading systems and testing trading strategies
newdigital, 2014.01.07 07:56
Watch Price In Relation To Ichimoku Cloud (adapted from dailyfx article)
- Price & Cloud Relationships
- Price Bouncing Off Cloud Shows You A Well-Supported Trend
- An Example Ichimoku Trade with USDJPY
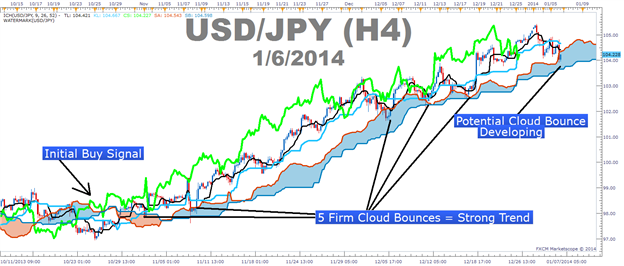
Ichimoku is a trend following indicator that almost anyone can learn to use with ease. When trading with Ichimoku, you’re often advised to start with the cloud to get a feel for whether or not price is trending up or down to past points on the chart. However, to get a better feel for the strength of the trend, it is better to see how price is reacting to the cloud rather than only looking where price is in relation to the cloud at any point in time.
Price & Cloud Interactions
USDJPY Has Demonstrated a Strong Trend Due To Multiple Cloud Bounces:
The cloud is a dynamic indicator that takes into consideration two aspects of a currency pair. In an uptrend, the top line of the cloud, traditionally known as Senkou Span A is composed of the mid-point between the 9 & 26 moving average based on mid-prices, or Tenkan-Sen & Kijun-Sen, and pushed forward 26-periods in order to give you a reference for the strength of a move. If current price is above the cloud, then current price is stronger than the mid-point of the 9 & 26 moving average from 26-periods ago, identifying the strength of the current trend.
The cloud’s bottom line in an uptrend, traditionally known as Senkou Span B, is composed of the mid-point over the last 52-periods on the chart and is also pushed forward 26-periods just like the top line. Therefore, if the current candle is above the cloud, which was created from 26-periods ago, then you can see that price is above both the mid-point of the 9 & 26 moving average as well as the mid-point over the last 52-sessions.
Price Bouncing Off Cloud Shows You a Well-Supported Trend
The key point of this article is that it’s not enough to simply know where price is in relation to the cloud to have a strong trend based trade. What you need to do is see if price is consistently on one side of the cloud or if price flips on either side of the cloud showing a very weak or non-existent trend. If there is no consistency with price and is consistently bouncing higher off the cloud proving the cloud as support and that the uptrend is strong, then it is best to take Ichimoku off your charts as Ichimoku doesn’t work well in ranges and will likely only clog up the charts if there is no clear trend.
A Cloud & Price Example Trade with USDJPY
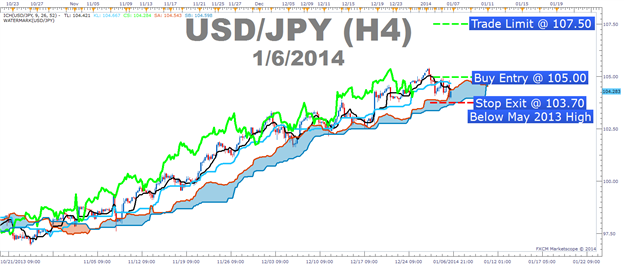
Entry to Buy: 105.00 (Breakout through resistance)
Stop: 103.70 (recent price action low and below May 2013 High – Pivotal Support)
Limit: 107.50 (Monthly R2 Pivot)
If this is your first reading of the Ichimoku report, here is a definitive guide on the versatile indicator:
- Full Candle Bodies above the Kumo Cloud
- The trigger line (black) is above the base line (light blue) or is crossing below
- Lagging line is above price action from 26 periods ago (Bright green line)
- Kumo ahead of price is bullish and rising (blue cloud = bullish Kumo)
- Free trading apps
- Over 8,000 signals for copying
- Economic news for exploring financial markets
You agree to website policy and terms of use
Ichimoku Kinko Hyo:
The Indicator Ichimoku Kinko Hyo is predefined to characterize the market Trend, Support and Resistance Levels, and to generate signals of buying and selling.
Author: MetaQuotes Software Corp.