Can someone translate this text from Russian to English?
- Open buy after the trend reversal and when the price is located in the top part of the rainbow (yellow zone).
- Close the order when the price reaches the green or red zones.
- Open sell trade after reversal of the trend - when the price is located in the lower part of the rainbow (yellow zone).
--------
Flat. It is recommended to use the additional indicators to filter the flat condition.
Not same but similar one:
Forum on trading, automated trading systems and testing trading strategies
How to Start with Metatrader 5
Sergey Golubev, 2013.07.15 21:19
Just good indicator found in Metatrader 5 CodeBase : GUPPY MULTIPLE MOVING AVERAGES :
These are two groups of exponential moving averages. The short term group is a 3, 5, 8, 10, 12 and 15 day moving averages. This is a proxy for the behaviour of short term traders and speculators in the market.
The long term group is made up of 30, 35, 40, 45, 50 and 60 day moving averages. This is a proxy for the long term investors in the market.
The relationship within each of these groups tells us when there is agreement on value - when they are close together - and when there is disagreement on value - when they are well spaced apart.
The relationship between the two groups tells the trader about the strength of the market action. A change in price direction that is well supported by both short and long term investors signals a strong trading opportunity. The crossover of the two groups of moving averages is not as important as the relationship between them.
When both groups compress at the same time it alerts the trader to increased price volatility and the potential for good trading opportunities.
==========
The Guppy Multiple Moving Average (GMMA) is an indicator that tracks the inferred activity of the two major groups in the market. These are investors and traders. Traders are always probing for a change in the trend. In a downtrend they will take a trade in anticipation of a new up trend developing. If it does not develop, then they get out of the trade quickly. If the trend does change, then they stay with the trade, but continue to use a short term management approach. No matter how long the up trend remains in place, the trader is always alert for a potential trend change. Often they use a volatility based indicator like the count back line, or a short term 10 day moving average, to help identify the exit conditions. The traders focus is on not losing money. This means he avoids losing trading capital when the trade first starts, and later he avoids losing too much of open profits as the trade moves into success.
We track their inferred activity by using a group of short term moving averages. These are 3, 5, 8, 10, 12 and 15 day exponentially calculated moving averages. We select this combination because three days is about half a trading week. Five days is one trading week. Eight days is about a week and a half.
The traders always lead the change in trend. Their buying pushes prices up in anticipation of a trend change. The only way the trend can survive is if other buyers also come into the market. Strong trends are supported by long term investors. These are the true gamblers in the market because they tend to have a great deal of faith in their analysis. They just know they are right, and it takes a lot to convince them otherwise. When they buy a stock they invest money, their emotions, their reputation and their ego. They simply do not like to admit to a mistake. This may sound overstated, but think for a moment about your investment in AMP or TLS. If purchased several years ago these are both losing investments yet they remain in many portfolios and perhaps in yours.
The investor takes more time to recognize the change in a trend. He
follows the lead set by traders. We track the investors inferred
activity by using a 30, 35, 40, 45, 50 and 60 day exponentially
calculated moving average. Each average is increased by one week. We
jump two weeks from 50 to 60 days in the final series because we
originally used the 60 day average as a check point.
This reflects the original development of this indicator where our focus was on the way a moving average crossover delivered information about agreement on value and price over multiple time frames. Over the years we have moved beyond this interpretation and application of the indicator. In the notes over the coming weeks we will show how this has developed.
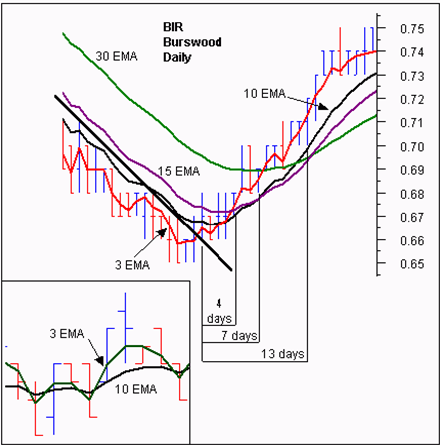
Our starting point was the lag that existed between the time of a genuine trend break and the time that a moving average cross over entry signal was generated. Our focus was on the change from a downtrend to an up trend. Our preferred early warning tool was the straight edge trend line which is simple to use and quite accurate. The problem with using a single straight edge trend line was that some breakouts were false. The straight edge trend line provided no way to separate the false from the genuine.
On the other hand, the moving average crossover based on a 10 and 30 day calculation, provided a higher level of certainty that the trend break was genuine. However the disadvantage was that the crossover signal might come many days after the initial trend break signal. This time lag was further extended because the signal was based on end of day prices. We see the exact cross over today, and if we were courageous, we could enter tomorrow. Generally traders waited for another day to verify that the crossover had actually taken place which delayed the entry until 2 days after the actual crossover. This time lag meant that price had often moved up considerably by the time the trade was opened.
The standard solution called for a combination of short term moving averages to move the crossover point further back in time so that it was closer to the breakout signaled by a close above the straight edge trend line. The drawback was that the shorter the moving average, the less reliable it became. In plotting multiple moving averages on a single chart display four significant features emerged.
They were:
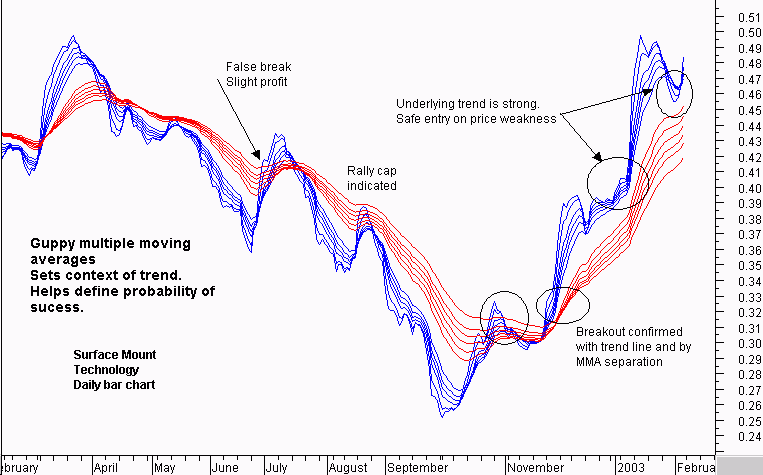
- A repeated pattern of compression and expansion in a group of six short term averages.
- The behavior was fractally repeated across different time frames. These short and long term groups were useful in understanding the inferred behavior of traders and investors.
- The degree of separation within groups and between groups provides a method of understanding the nature of the trend and trend change.
- The synchronicity was independent of the length of the individual moving averages. That is, at major trend turning points compression occurred across both long and short term groups and this provided early validation of signals generated by the straight edge trend line
- The relationship between moving averages and price was better understood as a relationship between value and price. The crossover of two moving averages represented an agreement on value over two different time frames. In a continuous open auction which is the mechanism of the market, agreement on price and value was transient and temporary. Such agreement often preceded substantial changes in the direction of the trend. The GMMA became a tool for identifying the probability of trend development.
These broad relationships, and the more advanced relationships used with the GMMA are summarized in the chart. Over the following series of articles we will examine the identification and application of each of these relationships.
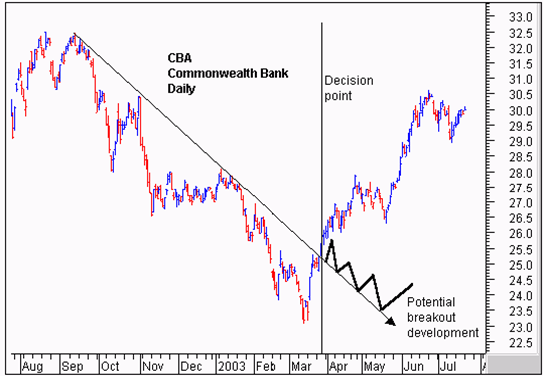
This is the most straightforward application of the GMMA and it worked well with “V’ shaped trend changes. It was not about taking the lag out of the moving average calculation. It is about validating a prior trend break signal by examining the relationship between price and value. Once the initial trend break signal is validated by the GMMA the trader is able to enter a breakout trade with a higher level of confidence.
The CBA chart shows the classic application of the GMMA. We start with the breakout above the straight edge trend line. The vertical line shows the decision point on the day of the breakout. We need to be sure that this breakout is for real and likely to continue upwards. After several months in a downtrend the initial breakout sometimes fails and develops as shown by the thick black line. This signals a change in the nature of the trend line from a resistance function prior to the breakout to a support function after the breakout.
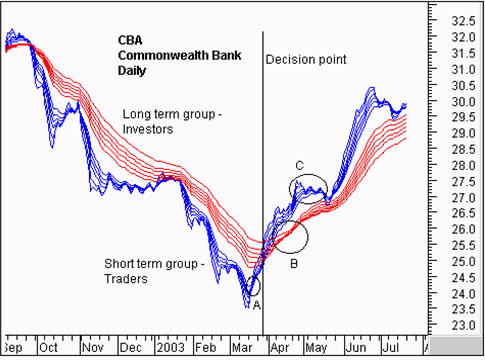
The GMMA is used to assess the probability that the trend break shown by the straight edge trend line is genuine. We start by observing the activity of the short term group. This tells us how traders are thinking. In area A we see a compression of the averages. This suggests that traders have reached an agreement on price and value. The price of CBA has been driven so low that many traders now believe it is worth more than the current traded price. The only way they can take advantage of this ‘cheap’ price is to buy stock. Unfortunately many other short term traders have reached the same conclusion. They also want to buy at this price. A bidding war erupts. Traders who believe they are missing out on the opportunity outbid their competitors to ensure they get a position in the stock at favorable prices.
The compression of these averages shows agreement about price and value. The expansion of the group shows that traders are excited about the future prospects of increased value even though prices are still rising. These traders buy in anticipation of a trend change. They are probing for a trend change.
We use the straight edge trend line to signal an increased probability of a trend change. When this signal is generated we observe this change in direction and separation in the short term group of averages. We know traders believe this stock has a future. We want confirmation that the long term investors are also buying this confidence.
The long term group of averages, at the decision point, is showing signs of compression and the beginning of a change in direction. Notice how quickly the compression starts and the decisive change in direction. This is despite the longest average of 60 days which we would normally expect to lag well behind any trend change. This compression in the long term group is evidence of the synchronicity relationship that makes the GMMA so useful.
This compression and change in direction tells us that there is an increased probability that the change in trend direction is for real – it is sustainable. This encourages us to buy the stock soon after the decision point shown.
The GMMA picks up a seismic shift in the markets sentiment as it
happens, even though we are using a 60 day moving average.. Later we
will look at how this indicator is used to develop reliable advance
signals of this change. This compression and eventual crossover within
the long term group takes place in area B. The trend change is
confirmed. The agreement amongst investors about price and value cannot
last. Where there is agreement some people see opportunity. There are
many investors who will have missed out on joining the trend change
prior to area B. Now the change is confirmed they want to get part of
the action. Generally investors move larger funds than traders. Their
activity in the market has a larger impact.
The latecomers can only buy stock if they outbid their competitors. The stronger the initial trend, the more pressure there is to get an early position. This increased bidding supports the trend. This is shown by the way the long term group continue to move up, and by the way the long term group of averages separates. The wider the spread the more powerful the underlying trend.

Even the traders retain faith in this tend change. The sell off that takes place in area C is not very strong. The group of short term averages dips towards the long term group and then bounces away quickly. The long term group of averages show that investors take this opportunity to buy stock at temporarily wakened prices. Although the long term group falters out at this point, the degree of separation remains relatively constant and this confirms the strength of the emerging trend.
The temporary collapse of the short term group comes after a 12% appreciation in price. Short term traders exit the trade taking short term profits at this level of return and this is reflected by the compression and collapse of the short term group of averages. As long term investors step into the market and buy CBA at these weakened prices, traders sense that the trend is well supported. Their activity takes off, and the short term group of averages rebounds, separates, and then run parallel to the long term group as the trend continues.
The GMMA identifies a significant change in the markets opinion about CBA. The compression of the short term and long term groups validates the trend break signal generated by a close above the straight edge trend line. Using this basic application of the GMMA, the trader has the confidence necessary to buy CBA at, or just after the decision points shown on the chart extract.
Using this straightforward application of the GMMA also kept traders out of false breakouts. The straight edge trend line provides the first indication that a downtrend may be turning to an up trend. The CSL chart shows two examples of a false break from a straight edge trend line. We start with decision point A. The steep downtrend is clearly broken by a close above the trend line. If this is a genuine trend break then we have the opportunity to get in early well before any moving average crossover signal.
This trend break collapses quickly. If we had first observed this chart near decision point B then we may have chosen to plot the second trend line as shown. This plot takes advantage of the information on the chart. We know the first break was false, and by taking this into account we set the second trend line plot. Can this trend break be relied upon? If we are right we get to ride a new up trend. If we are wrong we stand to lose money if we stay with a continuation of the downtrend. The straight edge trend line by itself does not provide enough information to make a good decision.
When we apply the GMMA we get a getter idea of the probability of the trend line break actually being the start of a new up trend. The key relationship is the level of separation in the long term group of averages, and trend direction they are traveling. At both decision point A and decision point B the long term group is well separated. Investors do not like this stock. Every time there is a rise in prices they take advantage of this to sell. Their selling overwhelms the market and drives prices down so the downtrend continues.
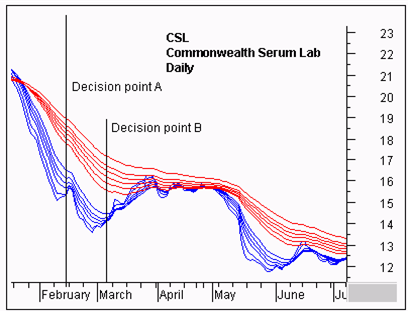
The degree of separation between the two groups of moving averages also makes it more difficult for either of the rallies to successfully change the direction of the trend. The most likely outcome is a weak rally followed by a collapse and continuation of the down trend. This observation keeps the trader, and the investor, out of CSL.
Looking forward we do see a convergence between the short term group of averages and the long term group of averages. Additionally the long term group begins to narrow down, suggesting a developing level of agreement about price and value amongst investors in April and May. In late March the 10 day moving average closes above the 30 day moving average, generating a classic moving average buy signal.
Forum on trading, automated trading systems and testing trading strategies
Something Interesting to Read February 2014
Sergey Golubev, 2014.02.03 09:22
Guppy Trading, Essential Methods For Modern Trading : Daryl Guppy

A compilation of the very best of Daryl Guppy
Daryl Guppy has been one of Australia's foremost experts on share
trading and charting for almost 20 years. His first book, Share Trading,
is still a must-read for people wanting to learn about the market and
is widely accepted as the best-selling trading book ever in Australia.
Guppy Trading contains detailed analysis of many topics, including:
making effective trades based on news events and informed trading
advanced application of the Guppy Multiple Moving Average to assess the true strength of a trend
how to establish and improve trade entry, exit and stop loss points in volatile markets
effective trading of international markets
safely integrating derivatives to boost portfolio returns.
Guppy Trading contains 23 of the most enduring and important chapters
from Guppy's earlier books, completely revised, and combines them with
10 entirely new chapters. These new chapters detail new trading methods
and instruments that have been developed to create additional
opportunities and ensure survival in interconnected modern markets. This
comprehensive compendium is critical reading for traders looking to
maximise their returns.
=================
MT5 CodeBase :
I ask for a translation from Russian to English and I receive a bunch of other similar indicators. :)
I'll check those other indicators out.
But I translated (you asked to translate - and I translated) ...
Forum on trading, automated trading systems and testing trading strategies
Can someone translate this text from Russian to English?
Sergey Golubev, 2016.01.19 13:04
- Open buy after the trend reversal and when the price is located in the top part of the rainbow (yellow zone).
- Close the order when the price reaches the green or red zones.
- Open sell trade after reversal of the trend - when the price is located in the lower part of the rainbow (yellow zone).
--------
Flat. It is recommended to use the additional indicators to filter the flat condition.
But I translated (you asked to translate - and I translated) ...
What a nice looking indicator ))
And ... a great topic about an indicator. Thanks Sergey.
- Free trading apps
- Over 8,000 signals for copying
- Economic news for exploring financial markets
You agree to website policy and terms of use
Can someone translate this text inside these images from Russian to English?