best indicators to determine trending versus bouncing market?
ive noticed that the momentum indicator for W1 works well for what i want to reference as far as volume and trending. however i am trading this EA on M5
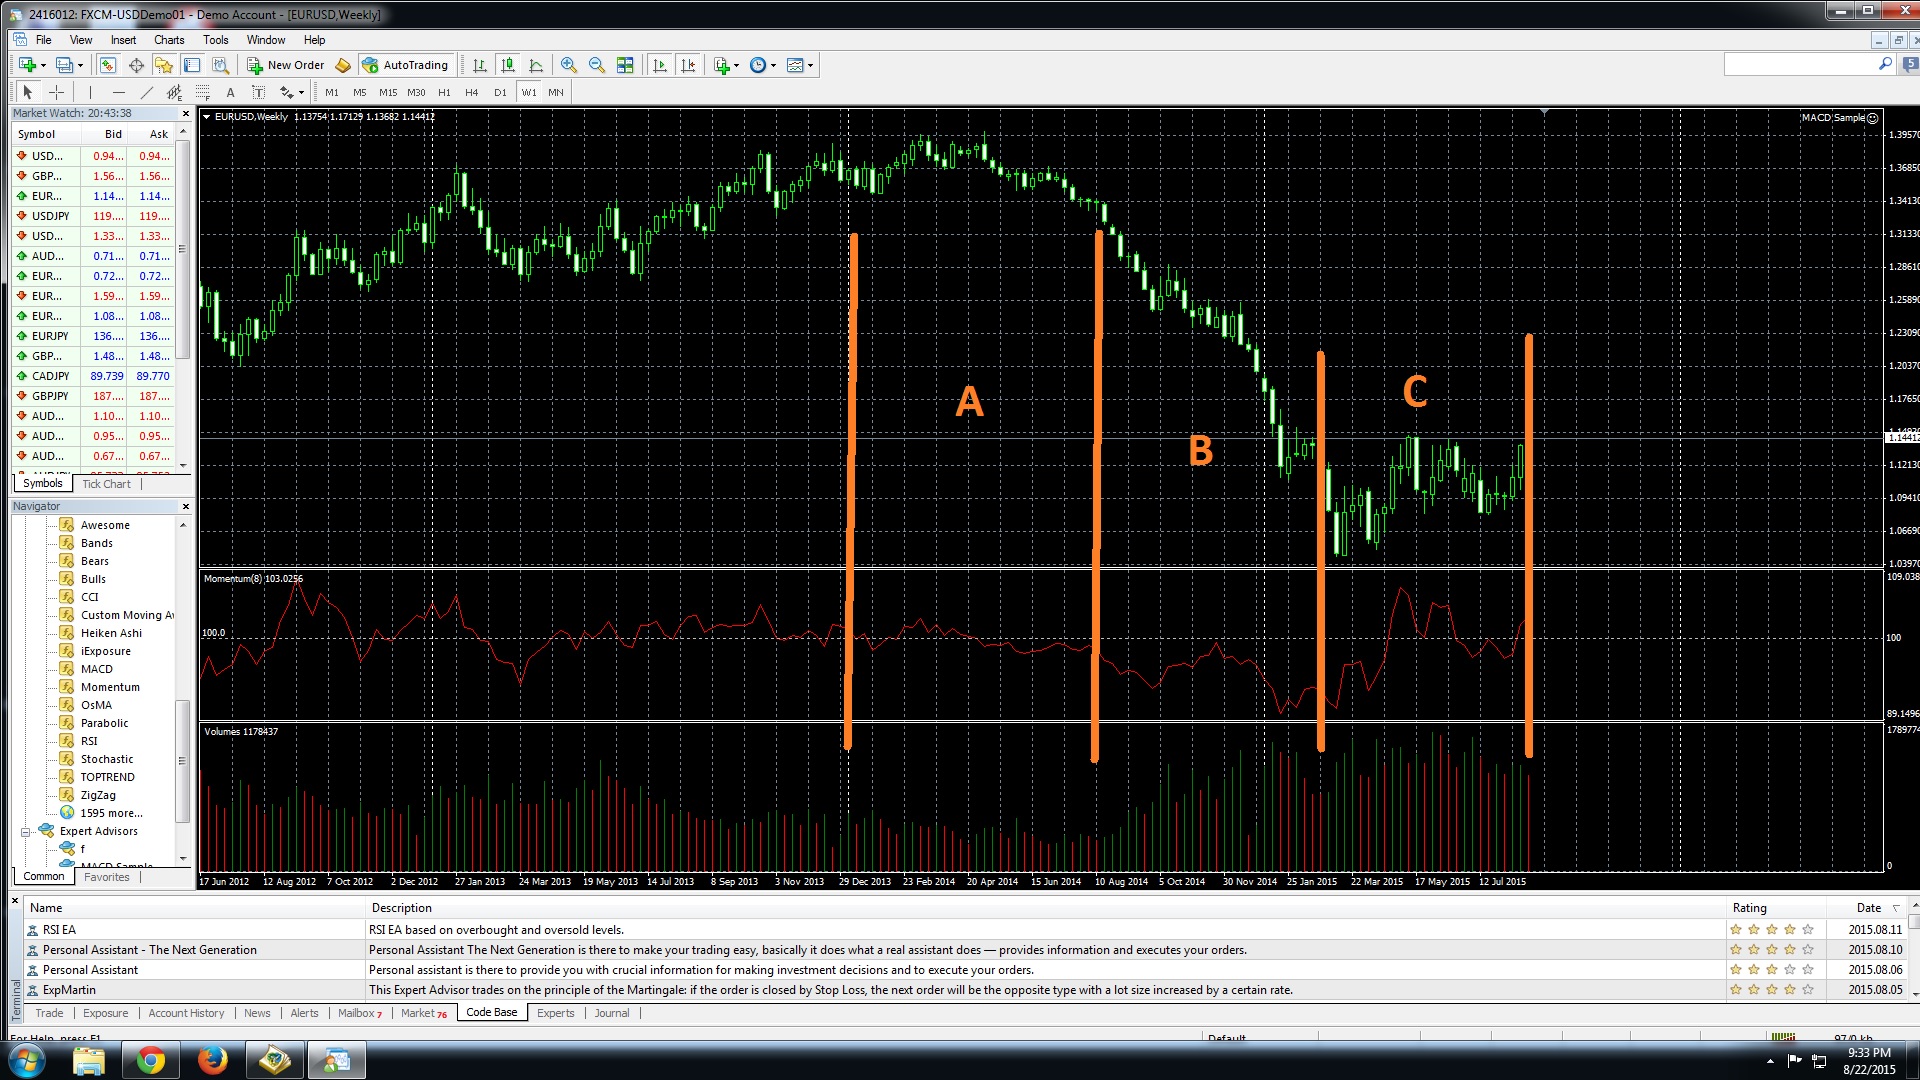
when momentum averages near the mean 100, i want to alter nothing,leave the highly sensitive multiplier (see case A, flat trend)
when momentum averages below 100, i want to alter short sensitivity vs long (see case B, directional trend)
when momentum averages 100 but jumps high and low under heavy volume, i want to make my multiplier less sensitive in both directions ( see case C, volatile trend)
averages of W1 momentum from a few weeks back will determine trend direction
highs versus lows of W1 momentum from a few weeks back will determine sensitivity of multiplier
logically i know how to do this but im new to programing so im still unsure how to implement the sampling
i dont know how to simply reference samples from a W1 macro chart, if im trading live on an active M5 chart
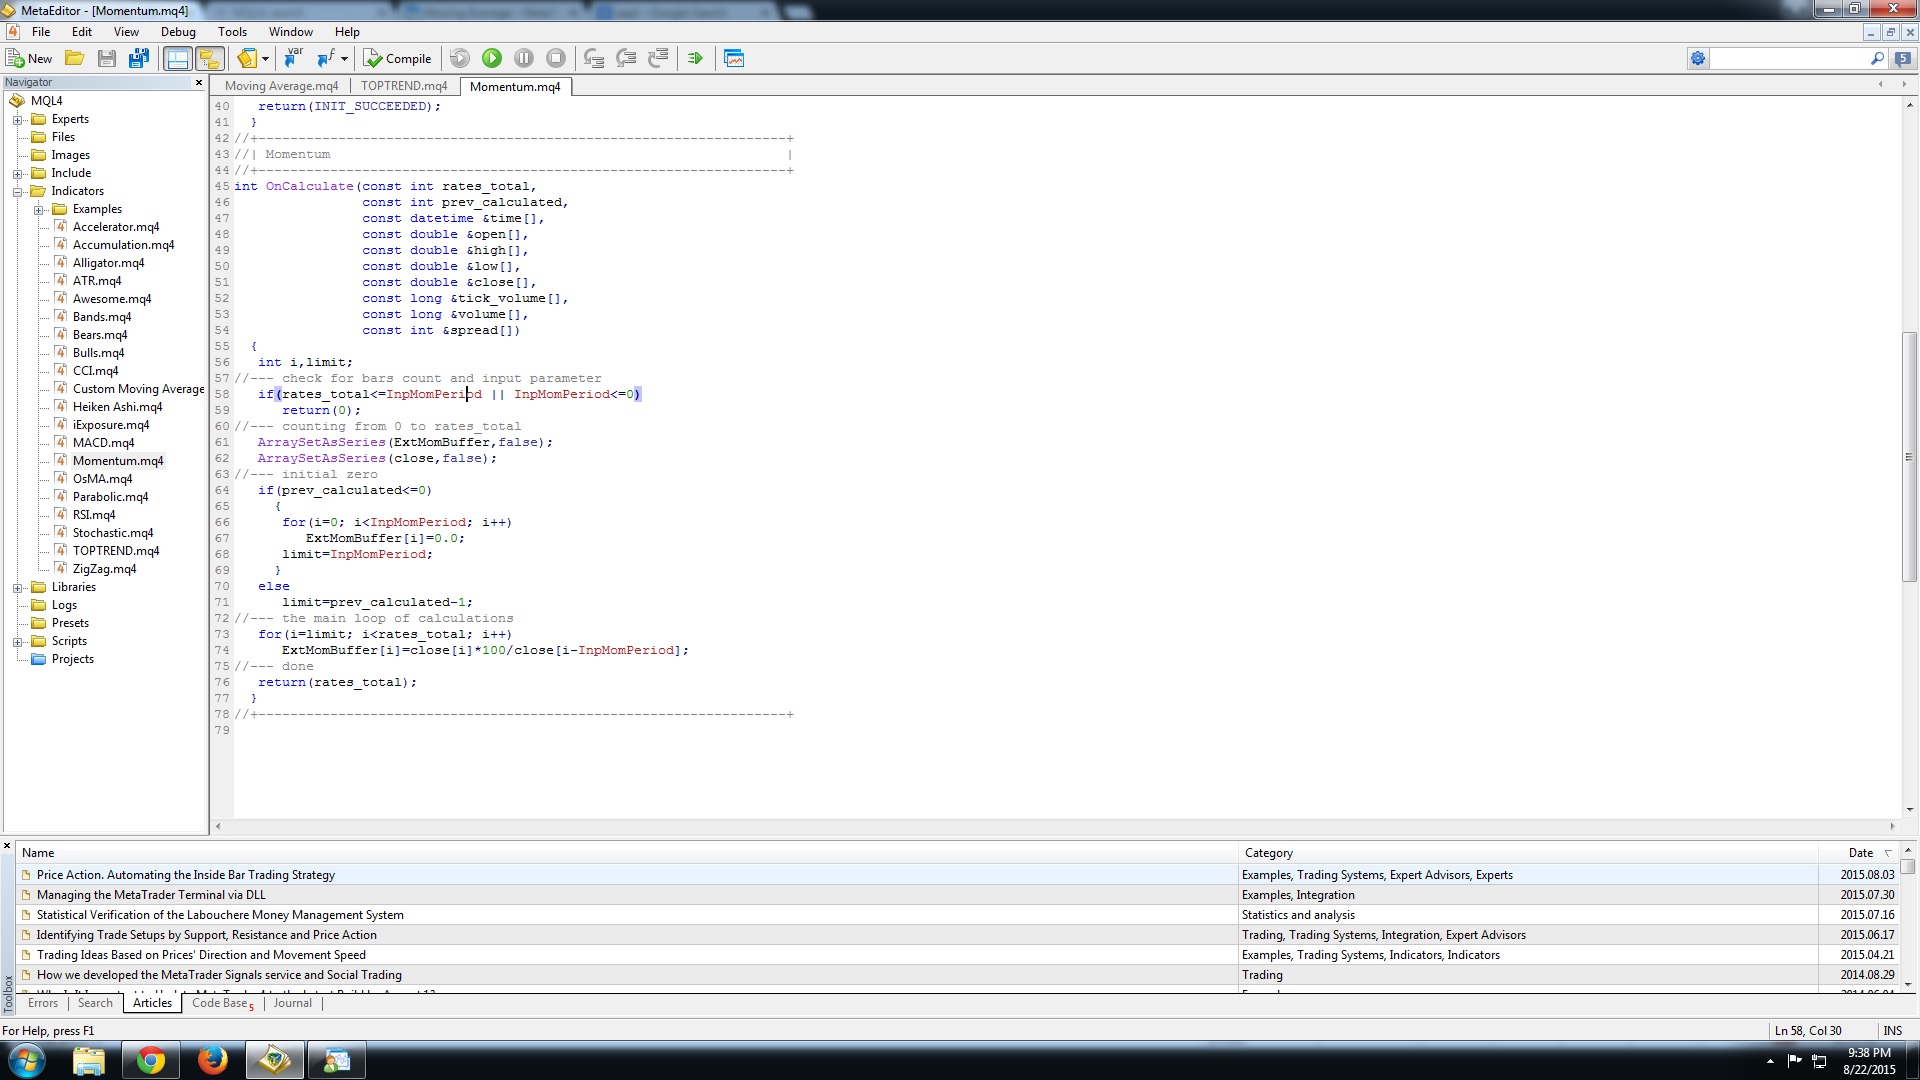
this is the momentum code....
can i simply average out a few ExtMomBuffer[i] points? i.e. (ExtMomBuffer[1]+ ExtMomBuffer[2]+ ExtMomBuffer[3]) / 3 ???
im assuming those are the graph output points, but i just want to clarify?
if its infact that simple, how do i reference this back to weekly momentum parameters while working in M5?
- Free trading apps
- Over 8,000 signals for copying
- Economic news for exploring financial markets
You agree to website policy and terms of use
greetings,
creating an EA that looks only at candle close prices to determine momentum
however i notice the sensitivity varies a lot based on whether a market is trending or bouncing, id imagine volume is also effecting sensitivity.
so i want to look at an indicator to determine these other conditions and create my own multiplier to vary the sensitivity
are there any simple ways to look back a month and determine trend vs bouncing?
are there any simple ways to look back a month an determine average volume?
thanks