Indicators: X2MA Transform Candles
Based on Swing Trading Entry Strategy
Your swing trading entry strategy is the most important part of the trade. This is the one time when all of your trading capital is at risk. Once the stock goes in your favor you can then relax, manage your stops, and await a graceful exit.
This page explains the basic price pattern that is used to enter stocks. Once you become familiar with it, you can try out more advanced strategies based on the specific pattern that you are trading.With your entry strategy, the first thing that you want be able to do is identify swing points. What's a swing point you ask? This is a pattern that consists of three candles. For entries on long positions, you look for a swing point low. For entries on short positions you look for a swing point high.
Identifying reversals using swing pointsFor a swing point low:
- The first candle makes a low.
- The second candle makes a lower low.
- The third candle makes a higher low.
This third candle tells us that the sellers have gotten weak and the stock will likely reverse.
For a swing point high:
- The first candle makes a high.
- The second candle makes a higher high.
- The third candle makes a lower high.
This third candle tells us that the buyers have gotten weak and the stock will likely reverse.
For our long entry strategy, we are trying to find stocks that have pulled back and made a swing point low.
Let's look at some examples:
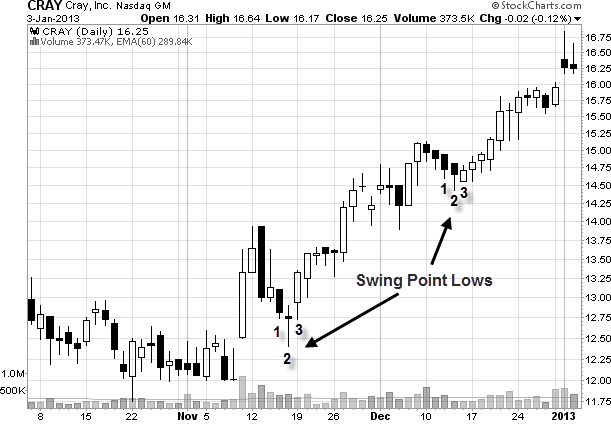
See how the pattern consists of a low (1), lower low (2), then a higher low (3)? This is a classic swing point low. Our entry strategy would be to enter this stock on the day of the third candle.
Now lets look at a stock on the short side.
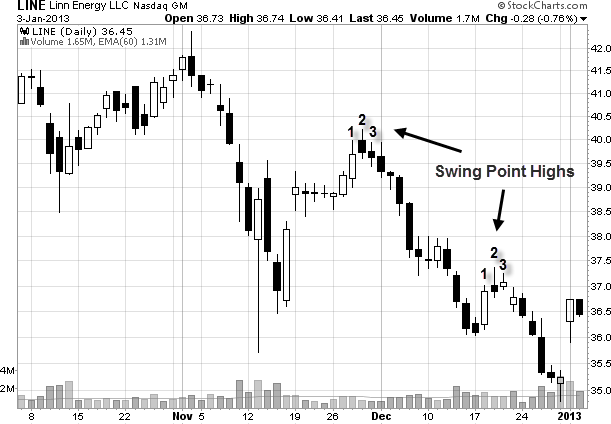
See how the pattern consists of a high (1), higher high (2), then a lower high (3)? We would look for an entry on the third candle.
It is worth noting that not all swing points will result in a powerful reversal. However, a reversal will not happen without a swing point developing. Take the time to go though a few stock charts and look at the reversals that happened in the past so that you are able to quickly identify this crucial price pattern.
Consecutive price patterns
Ideally, we want to trade stocks that have consecutive down days prior to the swing point low developing. This is the best case scenario. Here is an example on the long side: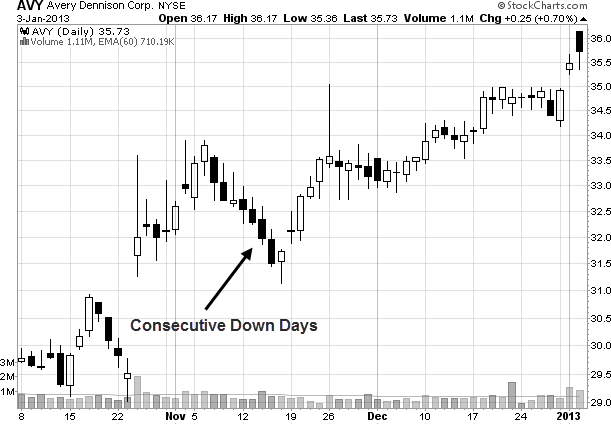
This is reversed on the short side. In this case, you want to look for consecutive up days prior to the swing point high developing.
When you are looking for swing points to develop, you always want to look to the left of the chart to see if the stock is at a support or resistance area on the chart. That will improve the reliability of this entry strategy.
Also, sometimes you may want to be more aggressive with your entry.
- Free trading apps
- Over 8,000 signals for copying
- Economic news for exploring financial markets
You agree to website policy and terms of use
X2MA Transform Candles:
The indicator transfers the price data to the new coordinates system associated with X2MA indicator values. The distance from High, Low, Open and Close source candlestick to X2MA moving average is used in the indicator for candlesticks parameters.
As a result, we have a candlestick chart altered by X2MA transformation allowing to perform all elements of technical analysis like a common chart. Appropriate custom and technical indicators can be applied to it.
Author: Nikolay Kositsin