Discussing the article: "Neural Networks in Trading: LSTM Optimization for Multivariate Time Series Forecasting (Final Part)"
How to get all test agents to write a single .bd file to a network share — in 4 steps
-
Shared folder
-
On the ‘main’ PC, create D:\DACShare.
-
Right-click → ‘Properties’ → ‘Advanced’ → shared resource DACGLSTM, Read/Write permissions for Everyone.
-
Final path: \\MAINPC\DACGLSTM.
-
-
Service account
-
compmgmt.msc → ‘Users’ → add mqlagent (any password).
-
In services.msc, for each MetaQuotes Tester Agent … → ‘Log On’ tab → ‘This account’ → MAINPC\mqlagent, enter the password, then restart the service.
-
-
Editing the Research code
input string SharedRoot = "\\\\MAINPC\\DACGLSTM\\"; string FileName = SharedRoot + "trajectories"; int handle = FileOpen(FileName + ".bd", FILE_WRITE|FILE_BIN|FILE_SHARE); // instead of FILE_COMMON(same replacement for reading). Compile the .ex5 file and copy it to all agents.
-
test Run the optimisation; the following will appear in each agent’s log:
Saved to: \\MAINPC\DACGLSTM\DACGLSTM.bd size=…
Open the shared folder — the file grows after each pass.
👉 Now all local and remote agents are writing to a single data buffer, and Study.mq5 can learn from any machine simply by opening the same .bd file
It’s not entirely clear how DACGLSTM.bd is updated
I’m running Research at one-month intervals. Full optimisation. Optimisation parameter: Agent from 1 to 8. Then the next month… but the file isn’t being updated at all. I can see that the file’s date is only updated at the start of a new test, and that’s it; the file size remains the same.
It’s not entirely clear how DACGLSTM.bd is updated
I’m running Research over a one-month interval. Full optimisation. Optimisation parameter: Agent from 1 to 8. Then the next month… but the file isn’t being updated at all. I can see that the file’s date is only updated at the start of a new test, and that’s it; the file size remains the same.
Could you please let me know the size of your DACGLSTM.bd file and the number of trades per month?
Please could you tell me the size of your DACGLSTM.bd file and the number of trades per month?
Through trial and error, I’ve now managed to accumulate 800MB of trade histories. I’ve tried various timeframes – 10 days, one month, 3, 6 and 12 months... After the latest run covering the second half of 2024, the file size increased from around 200 to 800. I then ran the second half of 2023 as well, but the file size didn’t change. There are roughly 3,000–3,500 trades over half a year; I’m using a 15-minute timeframe – all ticks. On shorter timeframes, the process simply takes far too long; I’m not yet prepared to wait that long. Oh, by the way, I’ve increased MaxReplayBuffer to 1,000,000; it was set to 500.
Study
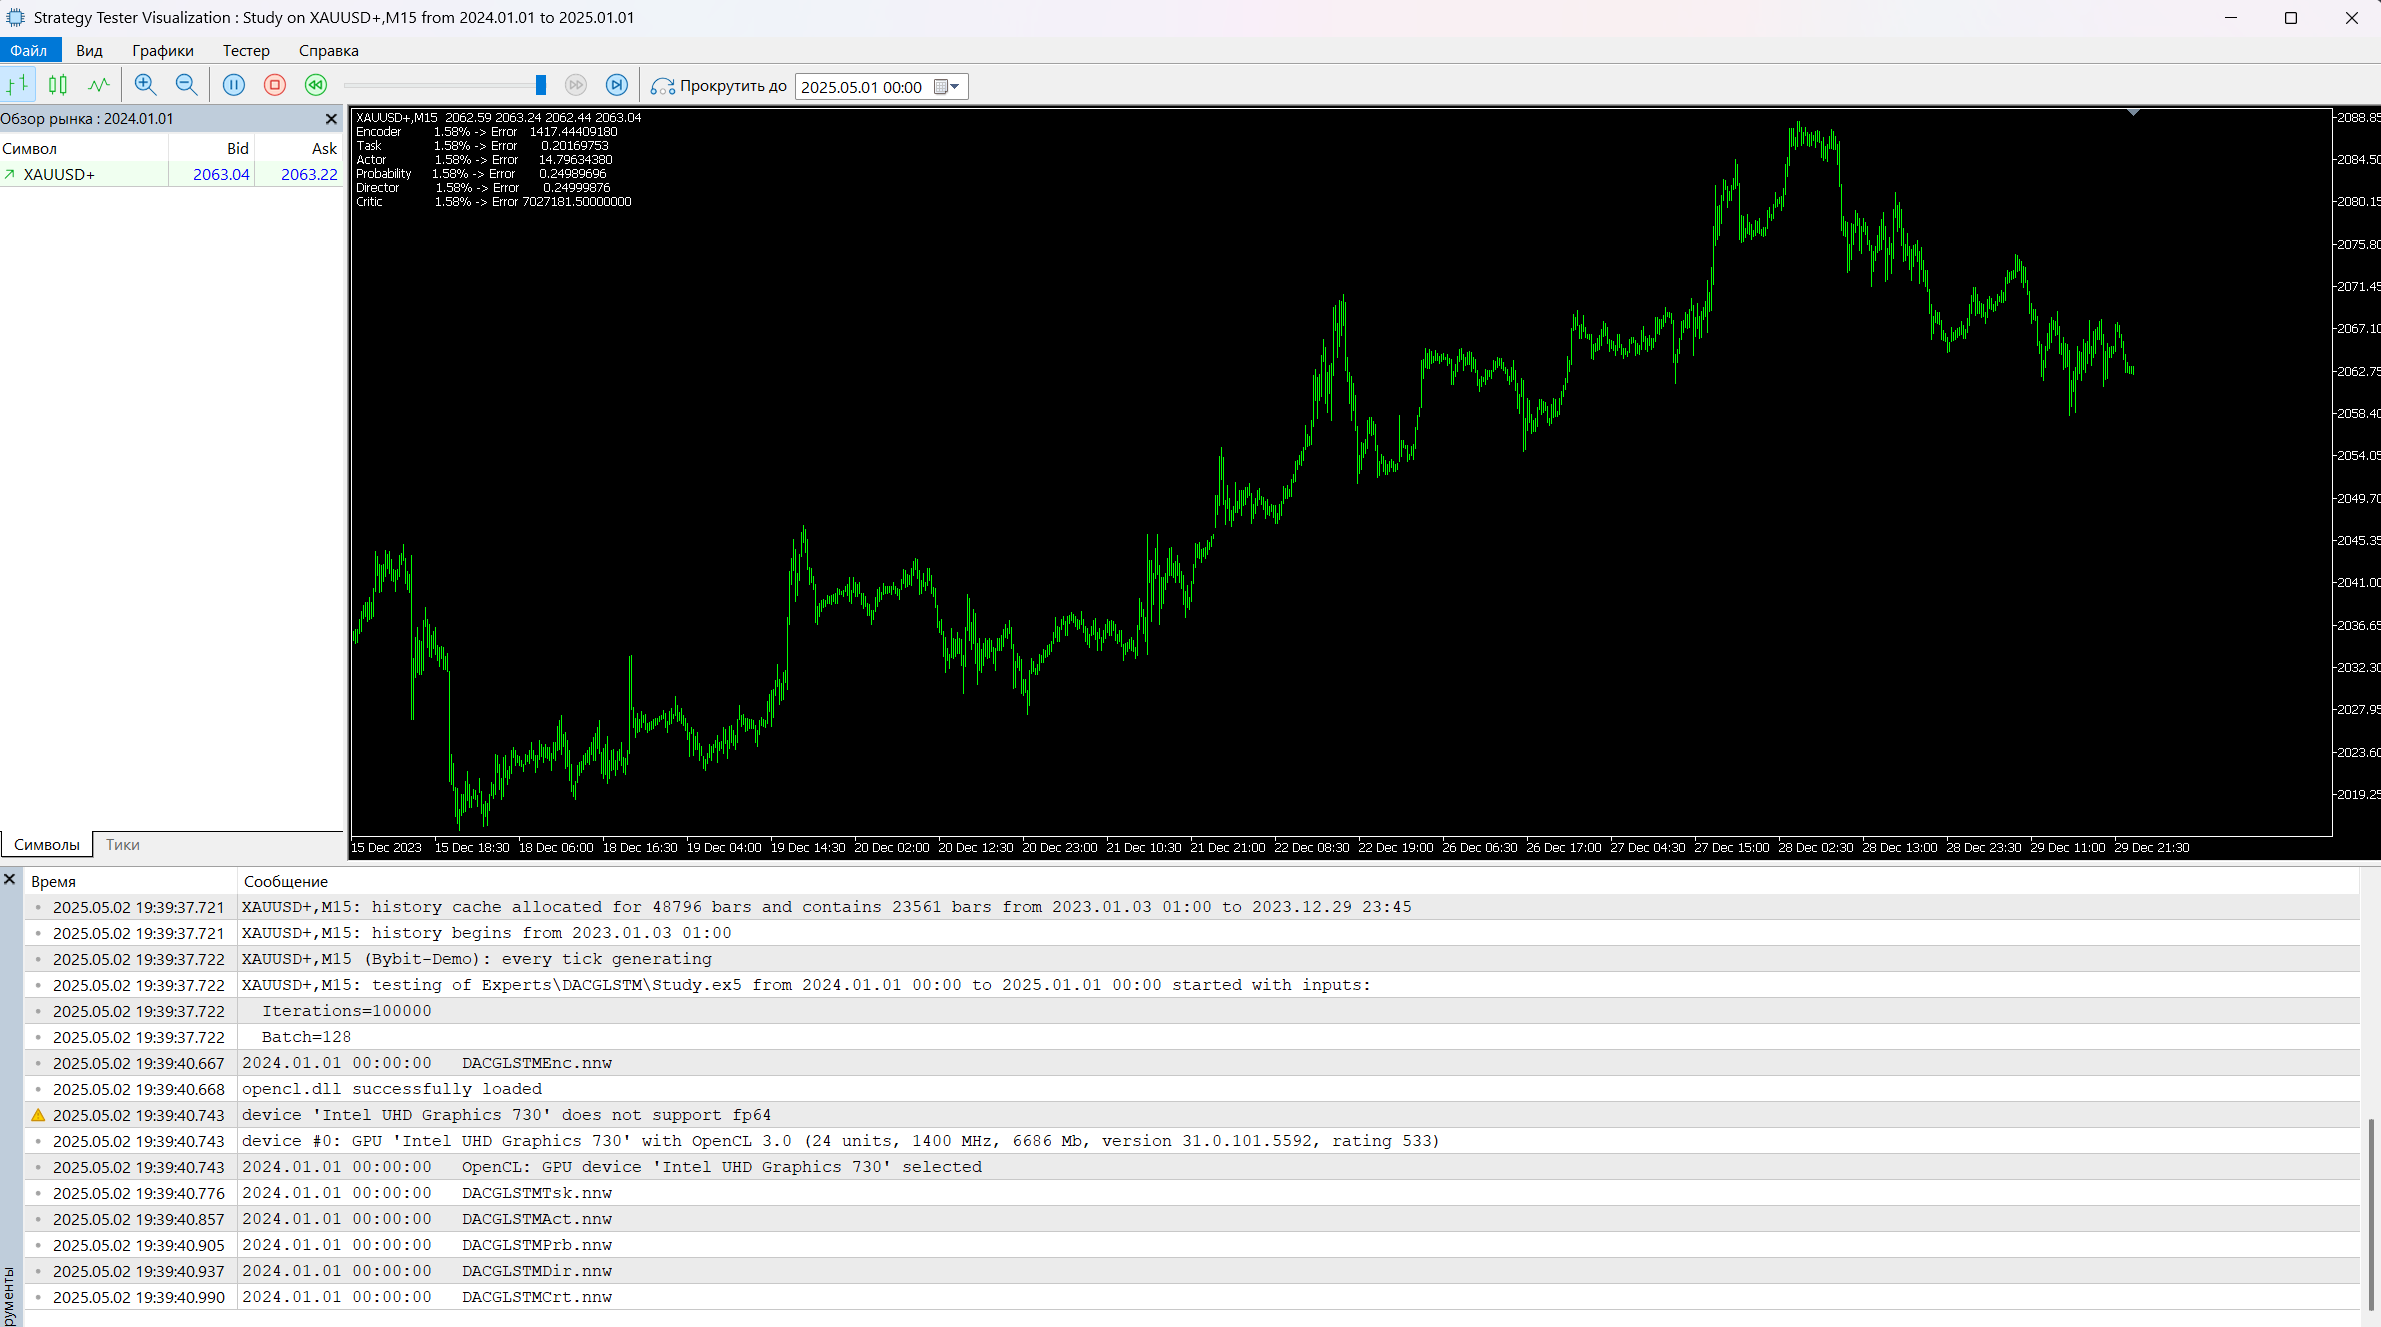
Simply place Study on the chart. Once installed, it reads the data files and then begins optimisation. Progress and results are displayed in the top-left corner of the chart.
On a 15-minute timeframe, 3,000 trades over half a year... This works out as a trade being opened on almost every second candle, and all of them are Sell trades. You can verify this either by running a single backtest with visualisation or by installing it on a demo account. Trades are opened and closed on the very next candle.
Simply place Study on the chart. Once installed, it reads the data files and then begins optimisation. Progress and results are displayed in the top-left corner of the chart.
On a 15-minute timeframe, 3,000 trades in half a year... This works out as a trade being opened on almost every second candle, and all of them are Sell trades. You can verify this either by running a single backtest with visualisation or by installing it on a demo account. Trades are opened and closed on the very next candle.
So, do I actually need to add it to the chart and run a test with optimisation? We’re not talking about the online version here, are we? It’s not clear what date range to use for the Study – any will do? I’ve run a test with visualisation; I can see the data changing in the top-left corner, but the chart isn’t moving. The percentages in the data are increasing gradually, simultaneously and uniformly, whilst the chart itself remains static.
- Free trading apps
- Over 8,000 signals for copying
- Economic news for exploring financial markets
You agree to website policy and terms of use
Check out the new article: Neural Networks in Trading: LSTM Optimization for Multivariate Time Series Forecasting (Final Part).
As previously noted, the DA-CG-LSTM framework is built around two fundamental components: attention modules and the modified CG-LSTM recurrent block. Together, these elements form a robust architecture that provides the model with the flexibility, noise resilience, and ability to capture complex multi-level temporal dependencies required for financial market applications. Under conditions of high volatility and market uncertainty, such properties are not merely desirable — they are essential for building reliable trading systems.
In the practical section of the previous article, we thoroughly examined the process of implementing the CG-LSTM block in MQL5. The resulting component successfully performs three critical functions: feature filtering to eliminate unnecessary noise, efficient management of the model's internal state to preserve long-term information, and data aggregation across multiple temporal scales. Its ability to suppress unstructured noise while maintaining stable learning dynamics enables the construction of models that preserve forecasting accuracy over extended historical periods.
Author: Dmitriy Gizlyk