How do you detect when your EA stops matching its backtest?
It heavily depends on the strategy if it is worth while. Also the issue with CUSUM is, there are simply more and less favourable periods, so in the end the CUSUM almost becomes an optimizable parameter which imo opinion is unwanted.
Considering CUSUM works as a filter you also have to ask the question how much profit you will throw away (asuming the strategy is a profitable one). For example one of my algos:
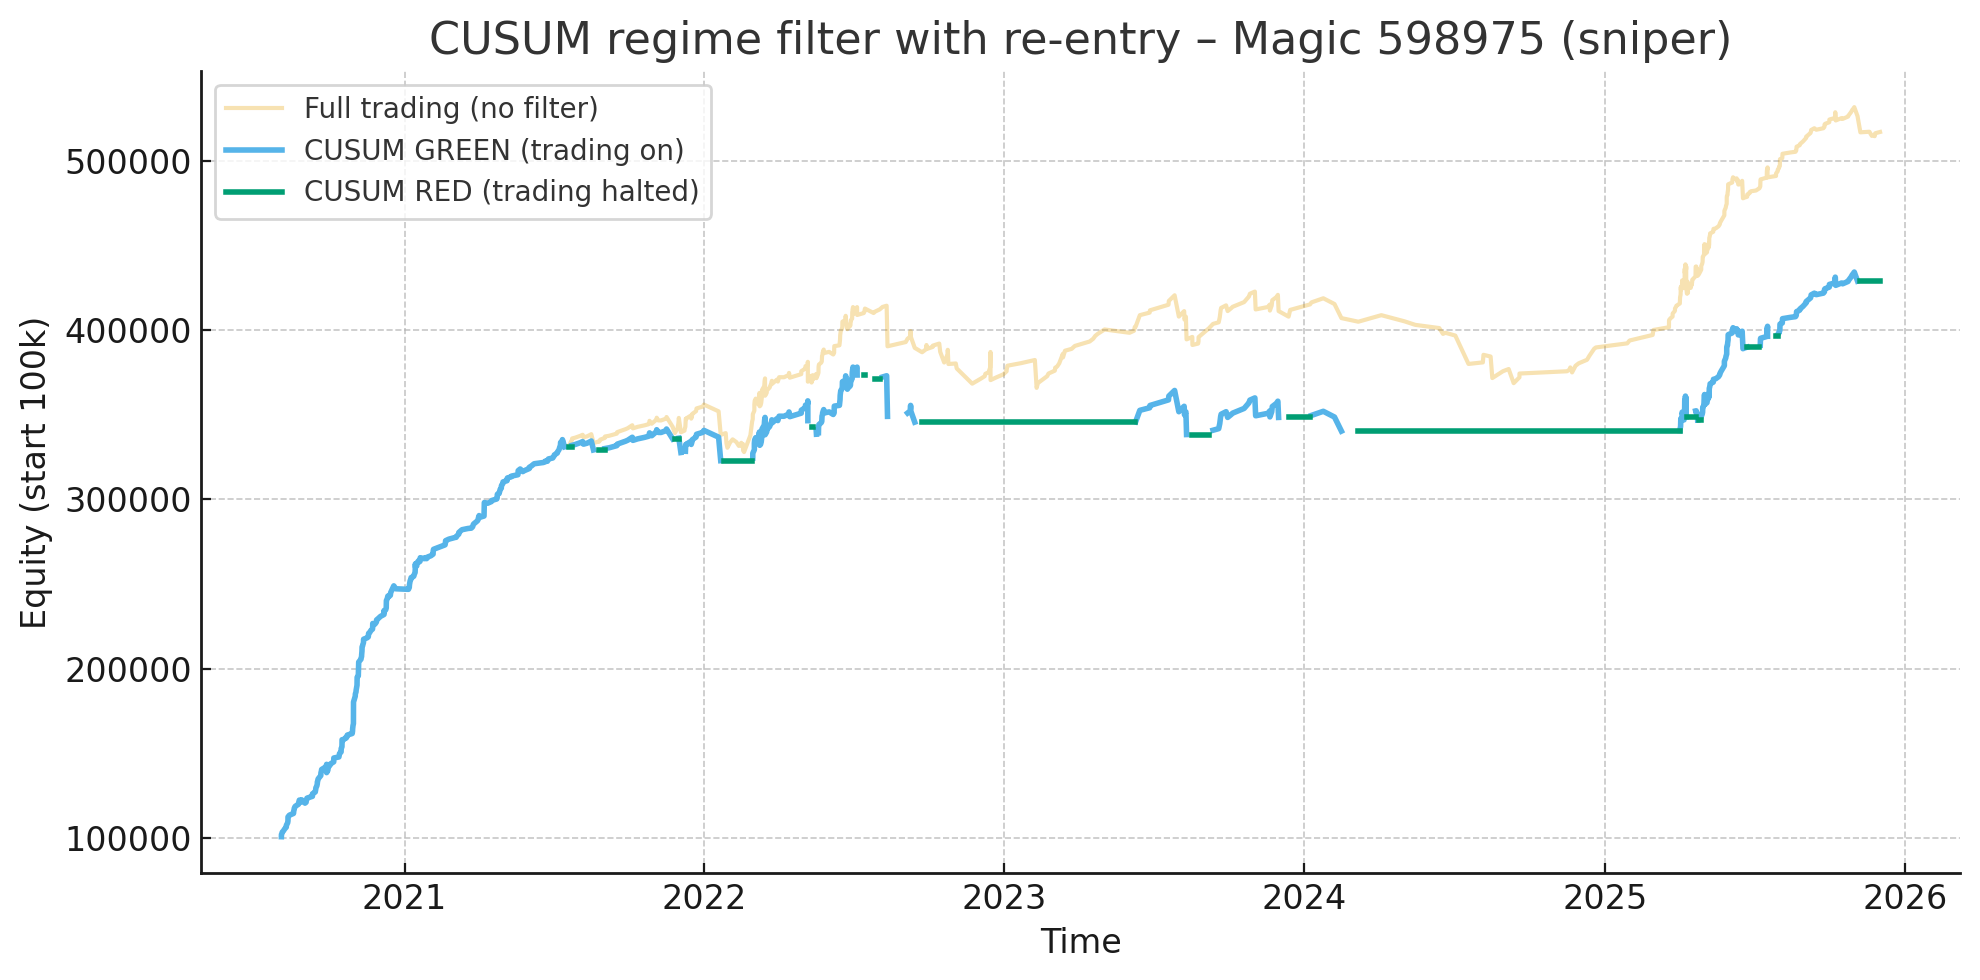
As can be seen, less drawdown but also less profit. The graph is in points.
In the end i have modified the algo such that a filter is applied based on 10% of outliers of the optimized period. This works almost as an automatic CUSUM as it halts trades if the algo detects the market is in the outlier state. This eliminates the lag that would be present using CUSUM and result is a more stable equity curve and more profit.
Weather this works in your case heavily depends on your algo.
It heavily depends on the strategy if it is worth while. Also the issue with CUSUM is, there are simply more and less favourable periods, so in the end the CUSUM almost becomes an optimizable parameter which imo opinion is unwanted.
Considering CUSUM works as a filter you also have to ask the question how much profit you will throw away (asuming the strategy is a profitable one). For example one of my algos:
As can be seen, less drawdown but also less profit. The graph is in points.
In the end i have modified the algo such that a filter is applied based on 10% of outliers of the optimized period. This works almost as an automatic CUSUM as it halts trades if the algo detects the market is in the outlier state. This eliminates the lag that would be present using CUSUM and result is a more stable equity curve and more profit.
Weather this works in your case heavily depends on your algo.
I forgot to attach the non-cusum result.
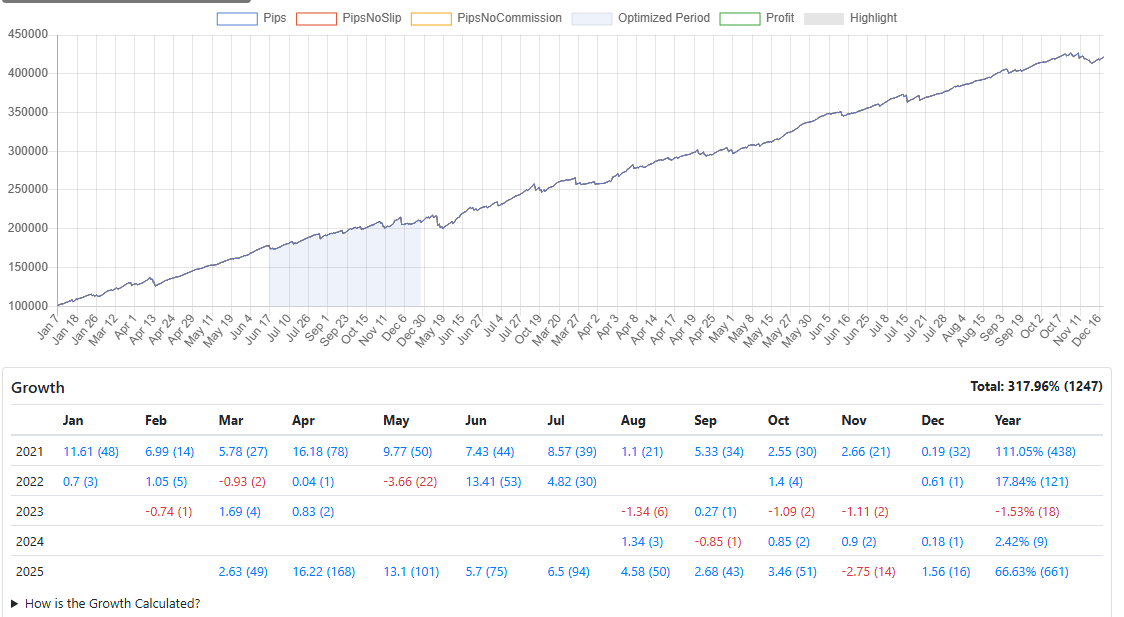
The image shows the same algo, same optimized period (blue section) and same symbol as the prevous image with the outlier filter applied (over the full period including the optimized period). Note that the image shows 1 year less data (year 2020 is absent). The profit is more or less the same as the no-filter/no-cusum (yellow line) from the previous image but with considarable less drawdown. It can be seen in the monthly stats, there are periods with no or very few trades similar as that of the cusum image. Because there is no lag, the profit increased considerable over the cusum method.
My algo is a very simple mathematical model, one position at the time, no overlapping trades, so It does not make sense to tell you what i filter as it may very well not apply to your situation, however the principle is as follows:
- Log the complete state (every parameter) at the moment of entry.
- Create a unfiltered (so both profitable and unprofitable trades) list per parameter and and set a hard cap on the 10% outliers.
- Run a test with the hard-cap filter applied to find out which parameter has the most impact out of sample.
Again, my algo is very simple and only has 2 optimizable parameters. There is only 1 filter obtained and applied in my case. I would not advice to apply a filter on every parameter because for each parameter you will be filtering out 10% of trades, in the end there is no drawdown because there is no trade left. I have experimented with different percentages, but 10% seems like the sweet spot in my case measured over thousands of samples.
Anyways, this method results in a more robust out of sample behavior with no extra optmiziable parameters, the filter is calculated once over the optmizied period.
I forgot to attached the non-cusum result.
The image shows the same algo, same optimized period (blue section) and same symbol as the prevous image with the outlier filter applied (over the full period including the optimized period). Note that the image shows 1 year less data (year 2020 is absent). The profit is more or less the same as the no-filter/no-cusum (yellow line) the previous image but with considarable less drawdown. It can be seen in the monthly stats, there are periods with no or very few trades similar as that of the cusum image. Because there is no lag, the profit increased considerable over the cusum method.
My algo is a very simple mathematical model, one position at the time, no overlapping trades, so It does not make sense to tell you what i filter as it may very well not apply to your situation, however the principle is as follows:
- Every entry you log the complete state (every parameter) of the entry logic.
- Create a unfiltered (so both profitable and unprofitable trades) list per parameter and and set a hard cap on the 10% outliers.
- Run a test with the hard-cap filter applied to find out which parameter has the most impact out of sample.
Again, my algo is very simple and only has 2 optimizable parameters. There is only 1 filter obtained and applied in my case. I would not advice to apply a filter on every parameter because for each parameter you will be filtering out 10% of trades, in the and there is no drawdown because there is no trade left. I have experimented with different percentages, but 10% seems like the sweet spot in my case measured over thousands of samples.
Anyways, this method results in a more robust out of sample behavior with extra optmiziable parameters, the filter is calculated once over the optmizied period.
One thing I'm taking from this: the 10% threshold works for your simple model, but for multi-parameter systems the combinatorial filtering risk you mention is real. Probably worth exploring which single parameter carries the most regime information rather than trying to filter all of them.
The more degrees of freedom (parameters) the greater the chance of curve fitting and out of sample derailment. There is no filter that will fix that. Reducing the number of optmiizable parameters is the only option.
- Log the complete state (every parameter) at the moment of entry.
- Create a unfiltered (so both profitable and unprofitable trades) list per parameter and and set a hard cap on the 10% outliers.
- Run a test with the hard-cap filter applied to find out which parameter has the most impact out of sample.
Could you please clarify your approach more? When you trade online, there is only one specific set of parameters, so there is no sense to log parameters per entry - the set is the same (until next reoptimization).
How do you define the outliers - outliers on what? Profit/loss, Profit factor, drawdown, count of historically accumulated optimized values of parameters?
If you use out of sample tests, then probably a rolling walk-forward optimization (and taking parameter sets passed forwards successively) will provide the same positive effect in pro-active manner?
As to the definition of the outlier. For example we have a strategy that sells when RSI < 50. We conduct a test and log the RSI value at the moment of entry. Then we will have a list of trades where the RSI values is between 50 and 75. 10 trades 50, 54, 60, 63, 65, 69, 70, 71, 74, 75. Acccording to the 90/10% rule we set the cap at 74. Trading forward (out of sample) the TS will not open any sell trade when RSI > 74. The example is kind of lame but i hope you get the point.
Personally i do not believe in any walk forward test taking parameters forward. It will become a mess fast considering each transition opens the can of worms over and over again and it will be hard to figure out the cause and effect.
In my case there is no re-optimization. I am using the tester as research vehicle ie. brute force pattern finding (similar to what fxsaber does). The filter i am talking about is a structural part of the pattern finding. Thus, during optimization a profitable pattern is found, a filter is calculated based upon trades during that period, the filter is applied and a new test run is performed on both the optimized period (for the calculation of the custom criterion) as well as out of sample (befor and after).
As can be seen in the image above, the blue part in the image is the optimized period somewhere between Juli and December 2021, the patterns found are structural and can last for years without any re-optmizmation.
As to the definition of the outlier. For example we have a strategy that sells when RSI < 50. We conduct a test and log the RSI value at the moment of entry. Then we will have a list of trades where the RSI values is between 50 and 75. 10 trades 50, 54, 60, 63, 65, 69, 70, 71, 74, 75. Acccording to the 90/10% rule we set the cap at 74. Trading forward (out of sample) the TS will not open any sell trade when RSI > 74. The example is kind of lame but i hope you get the point.
- Free trading apps
- Over 8,000 signals for copying
- Economic news for exploring financial markets
You agree to website policy and terms of use
I've been running live EAs for a while and kept running into the same blind spot: by the time I notice performance degraded, I'm already 10-15 trades deep into the drawdown. Looking at the equity curve doesn't catch it early — too noisy.
What I've started doing is comparing live trades against the backtest distribution statistically, trade by trade, instead of waiting for monthly review:
The math is basically Page's CUSUM test — standard SPC stuff, but I haven't seen much discussion of applying it to EA monitoring specifically. Most people either (a) eyeball equity, or (b) wait for X losing trades in a row, which is way too late.
Two things I'm still figuring out:
Threshold calibration — I'm using 4σ but it feels arbitrary. Has anyone tuned this for forex specifically? The tail behaviour is non-gaussian enough that standard SPC assumptions feel shaky.
Regime changes vs. genuine strategy decay — CUSUM fires on both. Any ideas how to tell them apart without waiting weeks?
Curious how others here handle this. Do you monitor per-trade deviation, or something else entirely