Discussing the article: "Tracking Account Dynamics: Balance, Equity, and Floating P/L Visualization in MQL5"
Check out the new article: Tracking Account Dynamics: Balance, Equity, and Floating P/L Visualization in MQL5.
Author: Nervada Emeule Adams
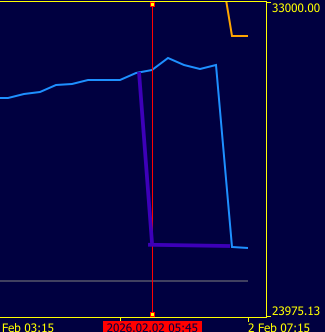
great article and indicator. It is very near to a balance+equity tracking indicator. There are a few serioius issues tho, so it is not quite correct. see image.
The red verticle line is when i attached the indicator. The lines are 3k or more above where they should be. ie see the lines of the open candle is correct on the right. The purple line was correct until i changed the indicator settings.
The purple lines are what i added with snipping tool. the light blue line was correct until I changed setting on the indicator, the chart refreshed with the image below. the lines were made incorrect.
- Free trading apps
- Over 8,000 signals for copying
- Economic news for exploring financial markets
You agree to website policy and terms of use
Check out the new article: Tracking Account Dynamics: Balance, Equity, and Floating P/L Visualization in MQL5.
Create a custom MT5 indicator that processes the entire deal history and plots starting balance, balance, equity, and floating P/L as continuous curves. It updates per bar, aggregates positions across symbols, and avoids external dependencies through local caching. Use it to inspect equity–balance divergence, realized vs. unrealized results, and the timing of risk deployment.
Per-bar sampling provides the right balance between accuracy and performance, aligning account curves with price charts while remaining efficient over long histories. Multi-symbol tracking is made practical through price caching, avoiding severe performance issues.
Accurate reconstruction requires processing the full deal history in chronological order, starting from the initial deposit and maintaining position state over time. Done correctly, this produces four curves that fully describe the account’s historical behavior.
Author: Nervada Emeule Adams