Wrong colors of supertrend indicator in modes with real data
Also, at first glance couldn't find anything wrong in the code.
Please post the code you are talking about.
<market-product-name-redacted>
Discussion of market products is prohibited on the forum. I removed the market product name from the post text and the screenshot you attached.
#property link          "https://www.earnforex.com/metatrader-indicators/supertrend/"
#property version       "1.03"

#property copyright     "EarnForex.com - 2019-2023"
#property description   "This indicator shows the trend using the ATR and an ATR multiplier."
#property description   " "
#property description   "WARNING: You use this indicator at your own risk."
#property description   "The creator of these indicator cannot be held responsible for damage or loss."
#property description   " "
#property description   "Find more on www.EarnForex.com"
#property icon          "\\Files\\EF-Icon-64x64px.ico"

#property indicator_chart_window
#property indicator_buffers 6
#property indicator_plots 2
#property indicator_type1 DRAW_COLOR_LINE
#property indicator_color1 clrGreen, clrRed
#property indicator_width1 2

double Trend[], TrendColor[], TrendDirection[];
double up[], dn[], trend[];
int ATR_handle;

/*
TrendDirection buffer contains the trend direction:
It is 0 if trending UP (Green)
It is 1 if trending DOWN (red)
*/

enum enum_candle_to_check {
   Current,
   Previous
};

//+------------------------------------------------------------------+
//|                                                                  |
//+------------------------------------------------------------------+
input string IndicatorName = "SPRTRND"; // Objects Prefix (used to draw objects)
input double ATRMultiplier = 2.0;       // ATR Multiplier
input int ATRPeriod = 100;              // ATR Period
input int ATRMaxBars = 1000;            // ATR Max Bars
input int Shift = 0;                    // Indicator shift, positive or negative
input enum_candle_to_check TriggerCandle = Previous;

//+------------------------------------------------------------------+
//| Custom indicator initialization function                         |
//+------------------------------------------------------------------+
int OnInit() {
   IndicatorSetString(INDICATOR_SHORTNAME, IndicatorName);

   SetIndexBuffer(0, Trend, INDICATOR_DATA);
   SetIndexBuffer(1, TrendColor, INDICATOR_COLOR_INDEX);
   SetIndexBuffer(2, TrendDirection, INDICATOR_DATA); // For iCustom reading (EAs and the like).
   SetIndexBuffer(3, up, INDICATOR_CALCULATIONS);
   SetIndexBuffer(4, dn, INDICATOR_CALCULATIONS);
   SetIndexBuffer(5, trend, INDICATOR_CALCULATIONS);

   PlotIndexSetInteger(0, PLOT_SHIFT, Shift);
   PlotIndexSetInteger(1, PLOT_SHIFT, Shift);

   PlotIndexSetDouble(0, PLOT_EMPTY_VALUE, EMPTY_VALUE);
   PlotIndexSetDouble(1, PLOT_EMPTY_VALUE, EMPTY_VALUE);

   ArraySetAsSeries(Trend, true);
   ArraySetAsSeries(TrendColor, true);
   ArraySetAsSeries(up, true);
   ArraySetAsSeries(dn, true);
   ArraySetAsSeries(trend, true);
   ArraySetAsSeries(TrendDirection, true);

   ATR_handle = iATR(Symbol(), Period(), ATRPeriod);

   return INIT_SUCCEEDED;
}

//+------------------------------------------------------------------+
//| Custom indicator iteration function                              |
//+------------------------------------------------------------------+
int OnCalculate (const int rates_total,
                 const int prev_calculated,
                 const datetime& time[],
                 const double& open[],
                 const double& High[],
                 const double& Low[],
                 const double& Close[],
                 const long& tick_volume[],
                 const long& volume[],
                 const int& spread[]) {
   ArraySetAsSeries(High, true);
   ArraySetAsSeries(Low, true);
   ArraySetAsSeries(Close, true);

// int counted_bars = IndicatorCounted();
   int counted_bars = 0;
   if (prev_calculated > 0) counted_bars = prev_calculated - 1;

   if (counted_bars < 0) return -1;
   if (counted_bars > 0) counted_bars--;
   int limit = rates_total - counted_bars;
   if (limit > ATRMaxBars) {
      limit = ATRMaxBars;
      if (rates_total < ATRMaxBars + 2 + ATRPeriod) limit = rates_total - 2 - ATRPeriod;
      if (limit <= 0) {
         Print("Need more historical data to calculate Supertrend");
         return 0;
      }
   }
   if (limit > rates_total - 2 - ATRPeriod) limit = rates_total- 2 - ATRPeriod;

   double ATR_buf[];
   ArraySetAsSeries(ATR_buf, true);
   CopyBuffer(ATR_handle, 0, 0, limit + 1, ATR_buf);

   for (int i = limit; i >= 0; i--) {
      bool flag, flagh;
      Trend[i] = EMPTY_VALUE;
      TrendDirection[i] = EMPTY_VALUE;
      double atr = ATR_buf[i];
      double medianPrice = (High[i] + Low[i]) / 2;
      up[i] = medianPrice + ATRMultiplier * atr;
      dn[i] = medianPrice - ATRMultiplier * atr;

      trend[i] = 1;

      if (Close[i] > up[i + 1]) {
         trend[i] = 1;
      } else if (Close[i] < dn[i + 1]) {
         trend[i] = -1;
      } else if (trend[i + 1] == 1) {
         trend[i] = 1;
      } else if (trend[i + 1] == -1) {
         trend[i] = -1;
      }

      if ((trend[i] < 0) && (trend[i + 1] > 0)) {
         flag = true;
      } else {
         flag = false;
      }

      if ((trend[i] > 0) && (trend[i + 1] < 0)) {
         flagh = true;
      } else {
         flagh = false;
      }

      if ((trend[i] > 0) && (dn[i] < dn[i + 1])) {
         dn[i] = dn[i + 1];
      } else if ((trend[i] < 0) && (up[i] > up[i + 1])) {
         up[i] = up[i + 1];
      }

      if (flag) {
         up[i] = medianPrice + ATRMultiplier * atr;
      } else if (flagh) {
         dn[i] = medianPrice - ATRMultiplier * atr;
      }

      if (trend[i] == 1) {
         Trend[i] = dn[i];
      } else if (trend[i] == -1) {
         Trend[i] = up[i];
      }
      if (trend[i] == 1) TrendColor[i] = 0;
      else if (trend[i] == -1) TrendColor[i] = 1;
      TrendDirection[i] = TrendColor[i];
   }
   return rates_total;
}
//+------------------------------------------------------------------+
Here is my own coding. Different code - same story.
//---
//+------------------------------------------------------------------+
//|                                                       SUPERTREND |
//|                                          Copyright 2025-2026, FM |
//+------------------------------------------------------------------+
//---
#property version       "1.00"
#property copyright     "FM 2025-2026"
#property description   "Indicator shows the SuperTrend signals based on ATR."
#property description   "WARNING: Use at your own risk!"
#property description   "WARNING: For demonstration purposes only!"
//---
//show indicator in chart window:
#property indicator_chart_window
//---
//indicator buffers and plots:
#property indicator_buffers 3
#property indicator_plots 1
//---
//plot1 properties:
#property indicator_type1 DRAW_COLOR_LINE
#property indicator_color1 clrRed, clrGreen
#property indicator_style1 STYLE_SOLID
#property indicator_width1 2
//---
//indicator buffer arrays:
double trendValue[]; //supertrend line: equals final upper band when downtrend; equals final lower band when uptrend
double trendColor[]; //supertrend line color (trend direction): 0 for red when down trend; 1 for green when up trend
double trendChange[]; //supertrend trend change in previous bar: 1: no trend change, 2: up to down, 3: down to up
//---
//user inputs:
input double Inp_AtrMultiplier = 2.5; // ATR Multiplier (2.5 for scalping on M1/M5)
input int Inp_AtrPeriod = 7;          // ATR Period (7 for scalping on M1/M5)
input int Inp_MaxBars = 1000;         // Limit quantity of bars used for calculation
//---
//other globals:
int atrHandle;
double atrBuffer[];
string shortName = "FM_SUPERTREND (ATR " + string(Inp_AtrPeriod) + "/" + DoubleToString(Inp_AtrMultiplier, 1) + ")";
//---
//+------------------------------------------------------------------+
//| Custom indicator initialization function                         |
//+------------------------------------------------------------------+
//---
int OnInit() {
//check consistency of inputs:
   if (Inp_AtrMultiplier <= 0 || Inp_AtrPeriod < 2 || Inp_MaxBars < Inp_AtrPeriod) {
      Print("Input parameters invalid!");
      return(INIT_FAILED);
   }
//indicator buffer mapping:
   SetIndexBuffer(0, trendValue, INDICATOR_DATA);
   SetIndexBuffer(1, trendColor, INDICATOR_COLOR_INDEX);
   SetIndexBuffer(2, trendChange, INDICATOR_CALCULATIONS); //fetch this by EA to get trend change: 1: no change, -2: up->down, 3: down->up
//---
//set the name to be displayed in the MT5 DataWindow
   IndicatorSetString(INDICATOR_SHORTNAME, shortName);
//---
//--- set the drawing line to an empty value:
   PlotIndexSetDouble(0, PLOT_EMPTY_VALUE, EMPTY_VALUE);
//---
//get handle for ATR indicator:
   atrHandle = iATR(Symbol(), Period(), Inp_AtrPeriod);
//---
   return(INIT_SUCCEEDED);
}
//---
//+------------------------------------------------------------------+
//| Custom indicator deinitialization function                       |
//+------------------------------------------------------------------+
//---
void OnDeinit(const int reason) {
//release ATR handle:
   if(atrHandle != INVALID_HANDLE) IndicatorRelease(atrHandle);
//---
//delete all objects from indicator run on chart:
   ObjectsDeleteAll(0, "DOWN->UP", 0, -1);
   ObjectsDeleteAll(0, "UP->DOWN", 0, -1);
//---
//delete indicator:
   ChartIndicatorDelete(0, 0, shortName);
}
//---
//+------------------------------------------------------------------+
//| Custom indicator iteration function                              |
//+------------------------------------------------------------------+
//---
int OnCalculate(const int rates_total,      //The total quantity of available candles on current tick or data update (size of arrays below).
                const int prev_calculated,  //Quantity of candles processed on previous call of OnCalculate().
                //If new rates_total is different from previous rates_total, new prev_calculated is automatically adjusted to new rates_total.
                const datetime &time[],     //Timestamp of each candle (opening time of candle).
                //This is not the tick time! Each tick within the same candle has the same timestamp!
                const double &open[],       //Opening price of each candle.
                const double &high[],       //Highest price of each candle.
                const double &low[],        //Lowest price of each candle.
                const double &close[],      //Closing price of each candle.
                const long &tick_volume[],  //Number of ticks (price updates) within each candle.
                const long &volume[],       //Total volume traded within each candle.
                const int &spread[]) {      //Spread (difference between bid and ask price) for each candle.
//---
//check if there are enough bars for calculations and if return value is correct:
   if(rates_total < Inp_AtrPeriod + 1 || prev_calculated < 0) {
      Print("Unable to calculate supertrend!");
      return(0);
   }
//---
//get ATR data:
   CopyBuffer(atrHandle, 0, 0, rates_total, atrBuffer);
//---
//initial calculations and settings:
   int iStart;
   if (prev_calculated == 0) { //first run or fundamental data update
      //set start index for array calculations for first run:
      iStart = (rates_total > Inp_MaxBars) ? rates_total - Inp_MaxBars + Inp_AtrPeriod : Inp_AtrPeriod; //!no -1!
      //start plottihg from iStart:
      PlotIndexSetInteger(0, PLOT_DRAW_BEGIN, iStart);
      //initialize the very first values of trendValue and trendColor (trend direction), assuming that there is an up trend:
      trendColor[iStart - 1] = 1;
      trendValue[iStart - 1] = 0;
      //initialize array trendChange[] with 0 (undefined):
      ArrayInitialize(trendChange, 0);
   } else //subsequent runs
      iStart = prev_calculated - 1;
//---
//calculate bands; check if trend has changed; set array values for bands, trend and color:
   for (int i = iStart; i < rates_total; i++) {
      //calculate basic upper and lower bands
      double basicUpperBand = ((high[i] + low[i]) / 2.0) + (Inp_AtrMultiplier * atrBuffer[i]);
      double basicLowerBand = ((high[i] + low[i]) / 2.0) - (Inp_AtrMultiplier * atrBuffer[i]);
      //apply logic that final trend value cannot increase in downtrend and cannot decrease in uptrend:
      if (close[i-1] > trendValue[i-1]) { //previous bar was in uptrend
         //in uptrend, final lower band cannot decrease:
         if (basicLowerBand > trendValue[i-1])
            trendValue[i] = basicLowerBand;
         else
            trendValue[i] = trendValue[i-1];
         trendColor[i] = 1; //keep uptrend
      } else { //previous bar was in downtrend
         //in downtrend, final lower band cannot increase:
         if (basicUpperBand < trendValue[i-1])
            trendValue[i] = basicUpperBand;
         else
            trendValue[i] = trendValue[i-1];
         trendColor[i] = 0; //keep downtrend
      }
      //check for a trend change (current bar calculation; updating on each tick):
      if (trendColor[i] == 1) { //currently there is an uptrend
         if (close[i] < trendValue[i]) { //price went below the uptrend line
            //switch to downtrend:
            trendColor[i] = 0;
            trendValue[i] = basicUpperBand; //first value of new downtrend line
         }
      } else { //currently there is an downtrend
         if (close[i] > trendValue[i]) { //price went above the downtrend line
            //switch to uptrend:
            trendColor[i] = 1;
            trendValue[i] = basicLowerBand; //first value of new uptrend line
         }
      }
      //check for validated trend change (uses data from previous bar; updating only when next bar appears):
      if (trendChange[i] == 0) { //(0 means undefined) first full run or subsequent first tick of new bar - trend change is set and kept until next bar opens
         trendChange[i] = 1; //no trend change (default when no change detected below)
         if (trendColor[i - 2] == 1 && trendColor[i - 1] == 0) { //change from up to down on previous finished bar
            trendChange[i] = 2;
            string uniqueName = "UP->DOWN\n" + string(time[i]);
            ObjectCreate(0, uniqueName, OBJ_ARROW_DOWN, 0, time[i - 1], trendValue[i - 1]);
            ObjectSetInteger(0, uniqueName, OBJPROP_ANCHOR, ANCHOR_BOTTOM);
            ObjectSetInteger(0, uniqueName, OBJPROP_COLOR, clrRed);
            ObjectSetInteger(0, uniqueName, OBJPROP_WIDTH, 5);
         }
         if (trendColor[i - 2] == 0 && trendColor[i - 1] == 1) { //change from down to up
            trendChange[i] = 3;
            string uniqueName = "DOWN->UP\n" + string(time[i]);
            ObjectCreate(0, uniqueName, OBJ_ARROW_UP, 0, time[i - 1], trendValue[i - 1]);
            ObjectSetInteger(0, uniqueName, OBJPROP_ANCHOR, ANCHOR_TOP);
            ObjectSetInteger(0, uniqueName, OBJPROP_COLOR, clrGreen);
            ObjectSetInteger(0, uniqueName, OBJPROP_WIDTH, 5);
         }
      }
   }
//---
//return value of prev_calculated for next call
   return(rates_total);
}
//+------------------------------------------------------------------+
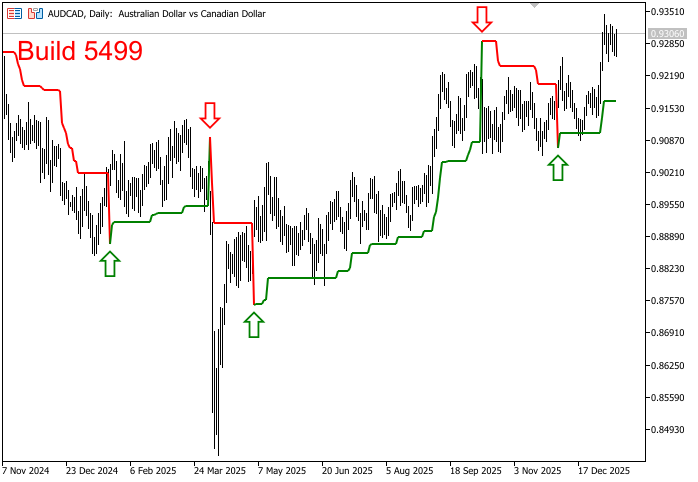
I attached your indicator to the chart and the colors look correct. What terminal build are you using?
I used Build 5445 as the Latest Release Version available. Now I have updated to Build 5495 as the Latest Beta Version (usually I don't mess with beta versions) and everything is fine.
Just wondering how such fundamental issues can happen in reputable mature software.
Anyway, thanks for looking into it to everybody who spent time into this!
I used Build 5445 as the Latest Release Version available.
5445 is a beta build. The latest release is 5430. Release builds are those listed here: https://www.metatrader5.com/en/releasenotes
I don't know for sure, but theoretically your problem could be related to a terminal bug that was present in several beta builds and has already been fixed.
I used Build 5445 as the Latest Release Version available. Now I have updated to Build 5495 as the Latest Beta Version (usually I don't mess with beta versions) and everything is fine.
Just wondering how such fundamental issues can happen in reputable mature software.
Anyway, thanks for looking into it to everybody who spent time into this!

- 2025.12.16
- www.mql5.com
- Free trading apps
- Over 8,000 signals for copying
- Economic news for exploring financial markets
You agree to website policy and terms of use
Most custom supertrend indicators available on the market or in the code base for free show the wrong color of the supertrend line under certain conditions.
During an uptrend, a red line is shown (should be green); during a downtrend, a green line is shown (should be red). Only after the very last switch of the trend, the correct color appears.
The attached pictures shows a run of the <market-product-name-redacted> indicator. This is just an example, the described effect occurs with other supertrend indicators, too.
Moreover, the strange behavior happens only when using real data in the MT5 terminal. When testing with historical data, the correct colors are shown throughout.
I have checked already the color values in the color buffer of the plot line - they are all correct. Nevertheless the wrong colors show up. Also, at first glance couldn't find anything wrong in the code.
Before digging deeper into the code or the setup, maybe somebody else came across this issue and has a simple explanation?