Can somebody help me with this OsMA-Indicator?
if (IndicatorLines)
   {
   for(int x = 1; x <= limit; x++)
      {
      if (OsMAPosRise[x] > OsMAPosFall[x + 1])
         {
         if (ObjectFind("BlueLine")) ObjectDelete("BlueLine");
         ObjectCreate("BlueLine", OBJ_TREND, 1, iTime(NULL, 0, x), OsMAPosRise[x], TimeCurrent(), OsMAPosRise[x]);
         ObjectSet("BlueLine", OBJPROP_COLOR, clrBlue);
         break;
         }
      }
      for(x = 1; x <= limit; x++)
         {
         if (OsMANegFall[x] < OsMANegRise[x + 1])
            {
            if (ObjectFind("RedLine")) ObjectDelete("RedLine");
            ObjectCreate("RedLine", OBJ_TREND, 1, iTime(NULL, 0, x), OsMANegFall[x], TimeCurrent(), OsMANegFall[x]);
            ObjectSet("RedLine", OBJPROP_COLOR, clrRed);
            break;
            }
         }
   }
Hi qjol,
it works perfect!! Thank you very much!
I studied your code and my code again. To be honest, I still have no idea why my code didn't work. When I look at the positive OsMA values: Every time the OsMA(x) < OsMA(x+1) I color the OsMA in navy. So when there is a color change from blue to navy, I know that the last blue value ( OsMA(x+1) ) is the place the line should be printed. Where is my logical mistake? Even if I look at your code I don't find the error in my code..
Edit:
I just see that it is not 100% ok. Here is the problem: The Blue Line is printed correct. But now the OsMA shows only FALLING red values for some periods without a RISING red value. So the Red Line is always printed at the current value, although it should be printed before the blue line at the last Crimson-colored value.
Excuse my English. I hope it was understandable...
Here a screenshot:
I corrected it the code and inserted also some corresponding lines in the chart. As I said, this will be the beginning of my own divergence-indicator.
There is just one thing that is not clear to me. When I change timeframes, the lines in the indicator also move to their correct place. But the corresponding lines in the chart are not replaced. And when I delete them manually, they don't comeback until I manually refresh the chart. Sounds strange, doesn't it?
Here is the code:
if (IndicatorLines)
   {
   for(int x = 1; x <= limit; x++)
      {
      if (OsMAPosRise[x] == 0 && OsMAPosRise[x + 1] > 0)
         {
         if (ObjectFind("OsMAPos")) ObjectDelete("OsMAPos");
         ObjectCreate("OsMAPos", OBJ_TREND, 1, iTime(NULL, 0, x+1), OsMAPosRise[x+1], TimeCurrent(), OsMAPosRise[x+1]);
         ObjectSet("OsMAPos", OBJPROP_COLOR, clrBlue);
         ObjectSet("OsMAPos", OBJPROP_RAY_RIGHT, false);
         if (ObjectFind("ChartLine1")) ObjectDelete("ChartLine1");
         ObjectCreate("ChartLine1", OBJ_TREND, 0, iTime(NULL, 0, x+1), iHigh(NULL, 0, x+1), TimeCurrent(), iHigh(NULL, 0, x+1));
         ObjectSet("ChartLine1", OBJPROP_COLOR, clrBlue);
         ObjectSet("ChartLine1", OBJPROP_RAY_RIGHT, false);
         break;
         }
      }
      for(x = 1; x <= limit; x++)
         {
         if (OsMANegFall[x] == 0 && OsMANegFall[x + 1] < 0)
            {
            if (ObjectFind("OsMANeg")) ObjectDelete("OsMANeg");
            ObjectCreate("OsMANeg", OBJ_TREND, 1, iTime(NULL, 0, x+1), OsMANegFall[x+1], TimeCurrent(), OsMANegFall[x+1]);
            ObjectSet("OsMANeg", OBJPROP_COLOR, clrRed);
            ObjectSet("OsMANeg", OBJPROP_RAY_RIGHT, false);
            if (ObjectFind("ChartLine2")) ObjectDelete("ChartLine2");
            ObjectCreate("ChartLine2", OBJ_TREND, 0, iTime(NULL, 0, x+1), iLow(NULL, 0, x+1), TimeCurrent(), iLow(NULL, 0, x+1));
            ObjectSet("ChartLine2", OBJPROP_COLOR, clrRed);
            ObjectSet("ChartLine2", OBJPROP_RAY_RIGHT, false);
            break;
            }
         }
   }
if(!ObjectCreate("OsMAPos", OBJ_TREND, 1, iTime(NULL, 0, x+1), OsMAPosRise[x+1], TimeCurrent(), OsMAPosRise[x+1]))
   {
   ObjectSet("OsMAPos", OBJPROP_COLOR, clrBlue);
   ObjectSet("OsMAPos", OBJPROP_RAY_RIGHT, false);
   }
Sorry, I don't get the point. The indicator lines work 100% now. It is just about the additional lines in the chart.
I modified the code like you did above but that doesn't fix the error.
you wrote
mar:
There is just one thing that is not clear to me. When I change timeframes, the lines in the indicator also move to their correct place. But the corresponding lines in the chart are not replaced. And when I delete them manually, they don't comeback until I manually refresh the chart. Sounds strange, doesn't it?
If you put that code in the init, the line will be deleted when changing timeframe, and redrawed then after
int init()
  {
  if (ObjectFind("OsMAPos")) ObjectDelete("OsMAPos");
   if (ObjectFind("OsMANeg")) ObjectDelete("OsMANeg");
  if (ObjectFind("ChartLine1")) ObjectDelete("ChartLine1");
  if (ObjectFind("ChartLine2")) ObjectDelete("ChartLine2");
}
- Free trading apps
- Over 8,000 signals for copying
- Economic news for exploring financial markets
You agree to website policy and terms of use
Hey guys,
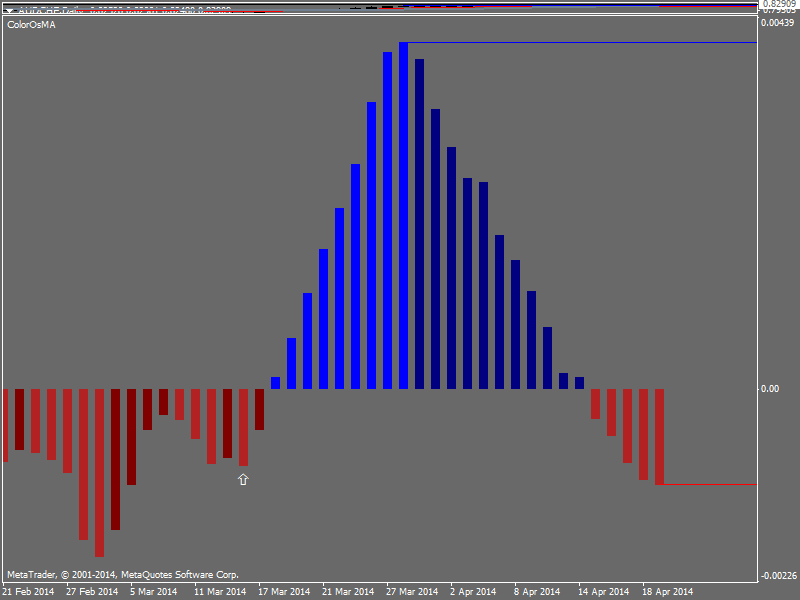
I made a ColorOsMA Indicator and it works fine. Now I wanted to add two horizontal lines to the indicator. It is the first step to program my own divergence-indicator.
The indicator should print the lines at the last top and the last low of the indicator. My definition for the last top / low is very simple: As soon as the first bar is printed which has a lower OsMA value, the last OsMA bar is "my" top. Same with the lows. You can see rising and falling values in different colors, so it is easier to see when the values of the OsMA are rising or falling compared to the last period.
But although the code seems to be correct, the lines are drawn totally wrong. The arrows show the correct places where the lines should be printed.
Can somebody help?
Here is the code: