Experts: Spread lister - current, min, max
Just a suggestion ...
Currently your code uses the symbol's current quote prices as reported by SymbolInfoDouble, and builds up the statistics as it progresses over time. This means that the program needs to be left running during the day for the data to collected. But why collect the data when it is already available in the tick history?
Instead, consider accessing the historical tick data directly and processing it. That will allow the program to present the statistics without waiting, not just for the current day but also previous days.
Sure thing- you might also consider a comparison of Timeseries values versus the SymbolInfoDouble.
Completely up to your preferences.
It is low effort to adjust the code to NOT delete the min/max values at midnight OR to add an addition min/max logic for predefined time (e.g. 1 week).
You may also export it to a file for future use - many nice ideas, depending on you appetite of reporting structure.
It is running on a separate chart in my terminal all day w/o major impact on performance.
I have no need to change your code. I already have my own code with a lot more complex analysis using tick history.
I only made the suggestion for the improvement of your own code, not mine.
As a side note, the times-series data only records the lowest spread for the bar, not the average.
- Free trading apps
- Over 8,000 signals for copying
- Economic news for exploring financial markets
You agree to website policy and terms of use
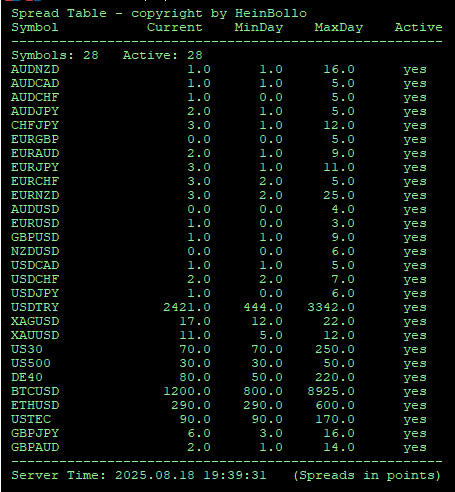
Spread lister - current, min, max:
EA Spread lister shows the current, min and max values for all symbols / instruments.
Author: Lars Rompe