Discussing the article: "SQLite capabilities in MQL5: Example of a dashboard with trading statistics by symbols and magic numbers"
There is a lack of tools that would allow you to work with a large trading history.
Unfortunately, this toolkit simply hangs up when requesting history, like many others.
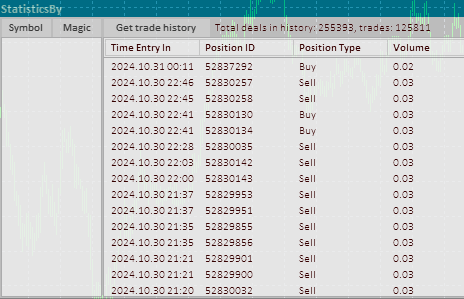
It takes five minutes to get the history. Then it is impossible to do anything with the window - full CPU load.
There is a lack of tools to deal with a large trading history.
Unfortunately, this toolkit just hangs up when requesting history, like many others.
Five minutes to get the history. Then it is impossible to do anything with the window - full CPU load.
Can I have investor access to the account?
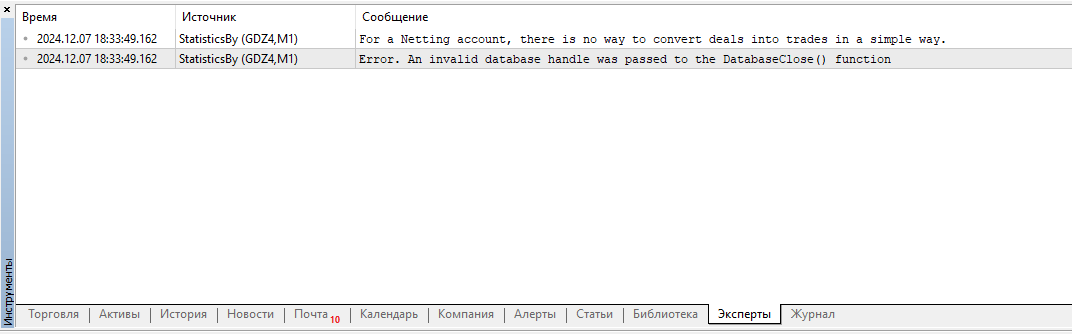
Unfortunately, there is no such possibility. But you can create something like this yourself: on a demo account, use a script to open/close the required number of positions by different symbols/magics in an hour using asynchronous OrderSend.
Doesn't want to work on the Moscow stock exchange
- Free trading apps
- Over 8,000 signals for copying
- Economic news for exploring financial markets
You agree to website policy and terms of use
Check out the new article: SQLite capabilities in MQL5: Example of a dashboard with trading statistics by symbols and magic numbers.
The function is designed to draw the final statistics table for the selected symbol, magic number, or the entire account. The function receives the type of the statistics table and the name of the symbol, or the string value of the magic number, or the account number. The text determines the index of the symbol, magic number or account in the corresponding array of statistical data structures. From the required structure, we use the obtained index to get all statistical data into the structure, and then we arrange them in the rendered table according to the coordinates of its cells. In this case, the horizontal offsets of the displayed text are calculated in such a way that the data header is tied to the left edge of the table cell, and the text of the data value is tied to the right edge of its table cell. All data is displayed in four columns so that they are visually grouped on the panel in two columns in the form of "title -- value".
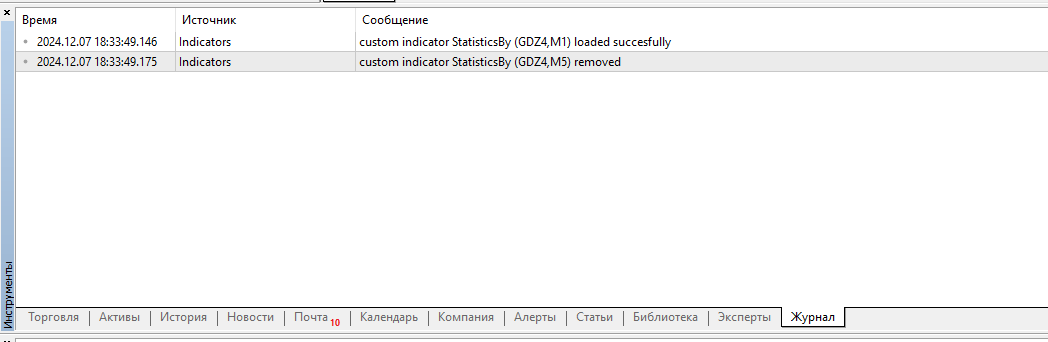
Let's compile the indicator and see what we got:
We can see that all the declared functionality works as expected. We can see slight "blinking" of text in tables when moving the cursor and scrolling tables. But this is the result of a suboptimal redrawing scheme - the entire visible part of the table is constantly redrawing. This can be avoided by more complex logic for handling table rows under the cursor, but this is not our objective here.
Author: Artyom Trishkin