MT4 drawing error when candles are deleted
Fix your broken indicator. Post your code if you want help with that.
I created a simple indicator because I don't want to share my original one.
This one also breaks down when candles are deleted from the chart.
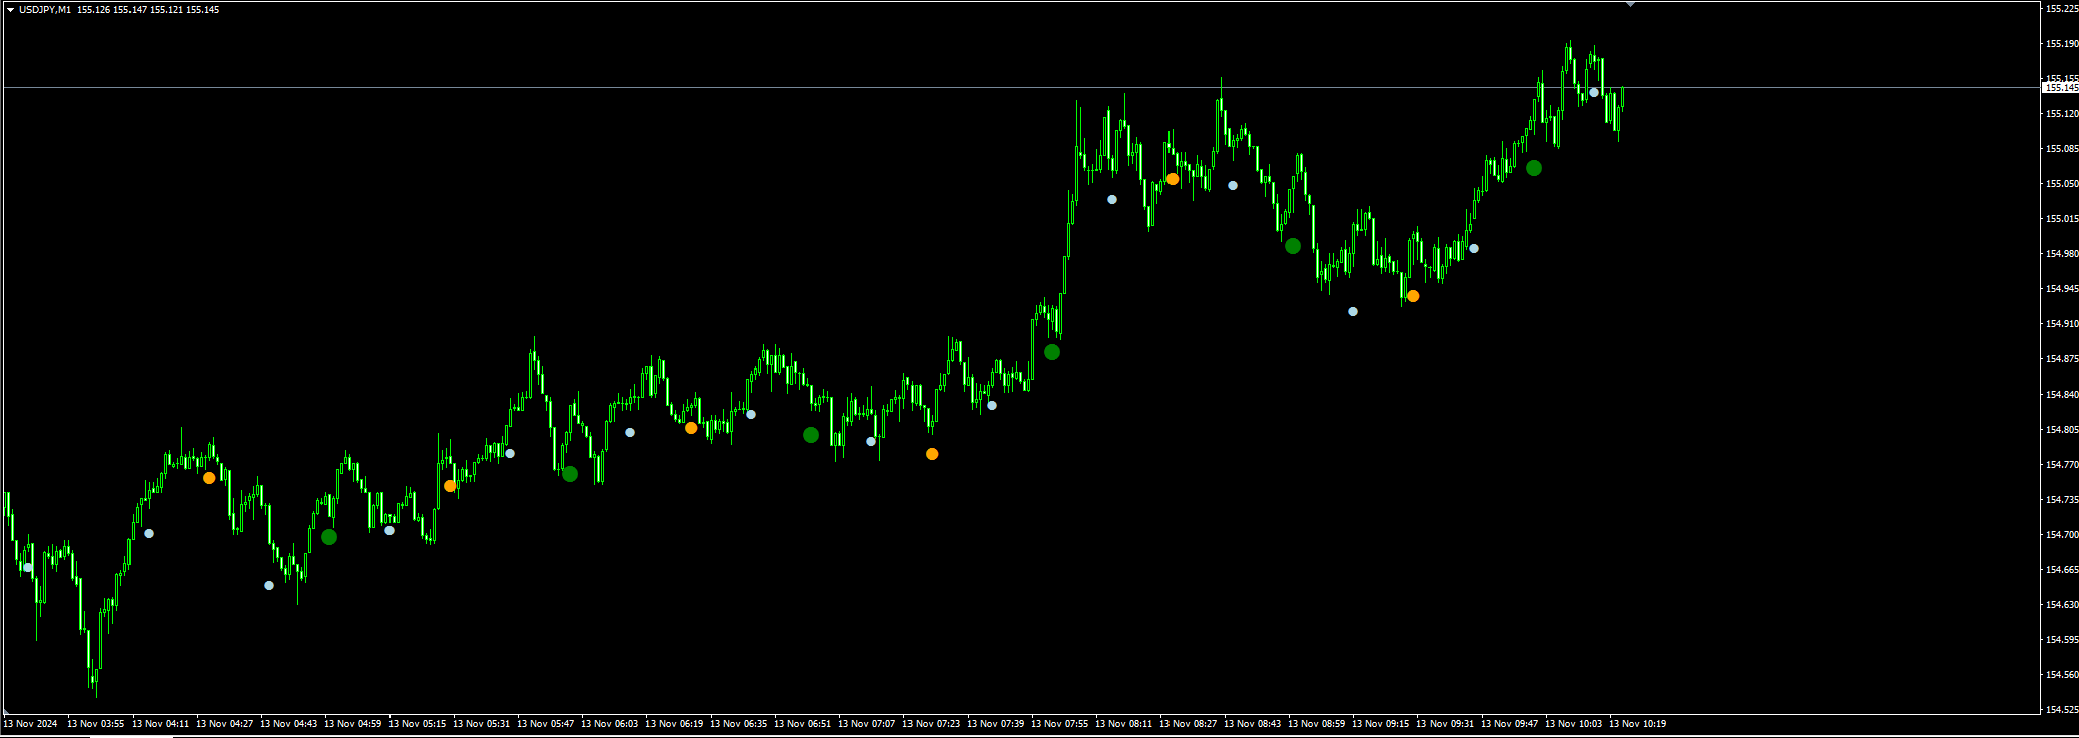
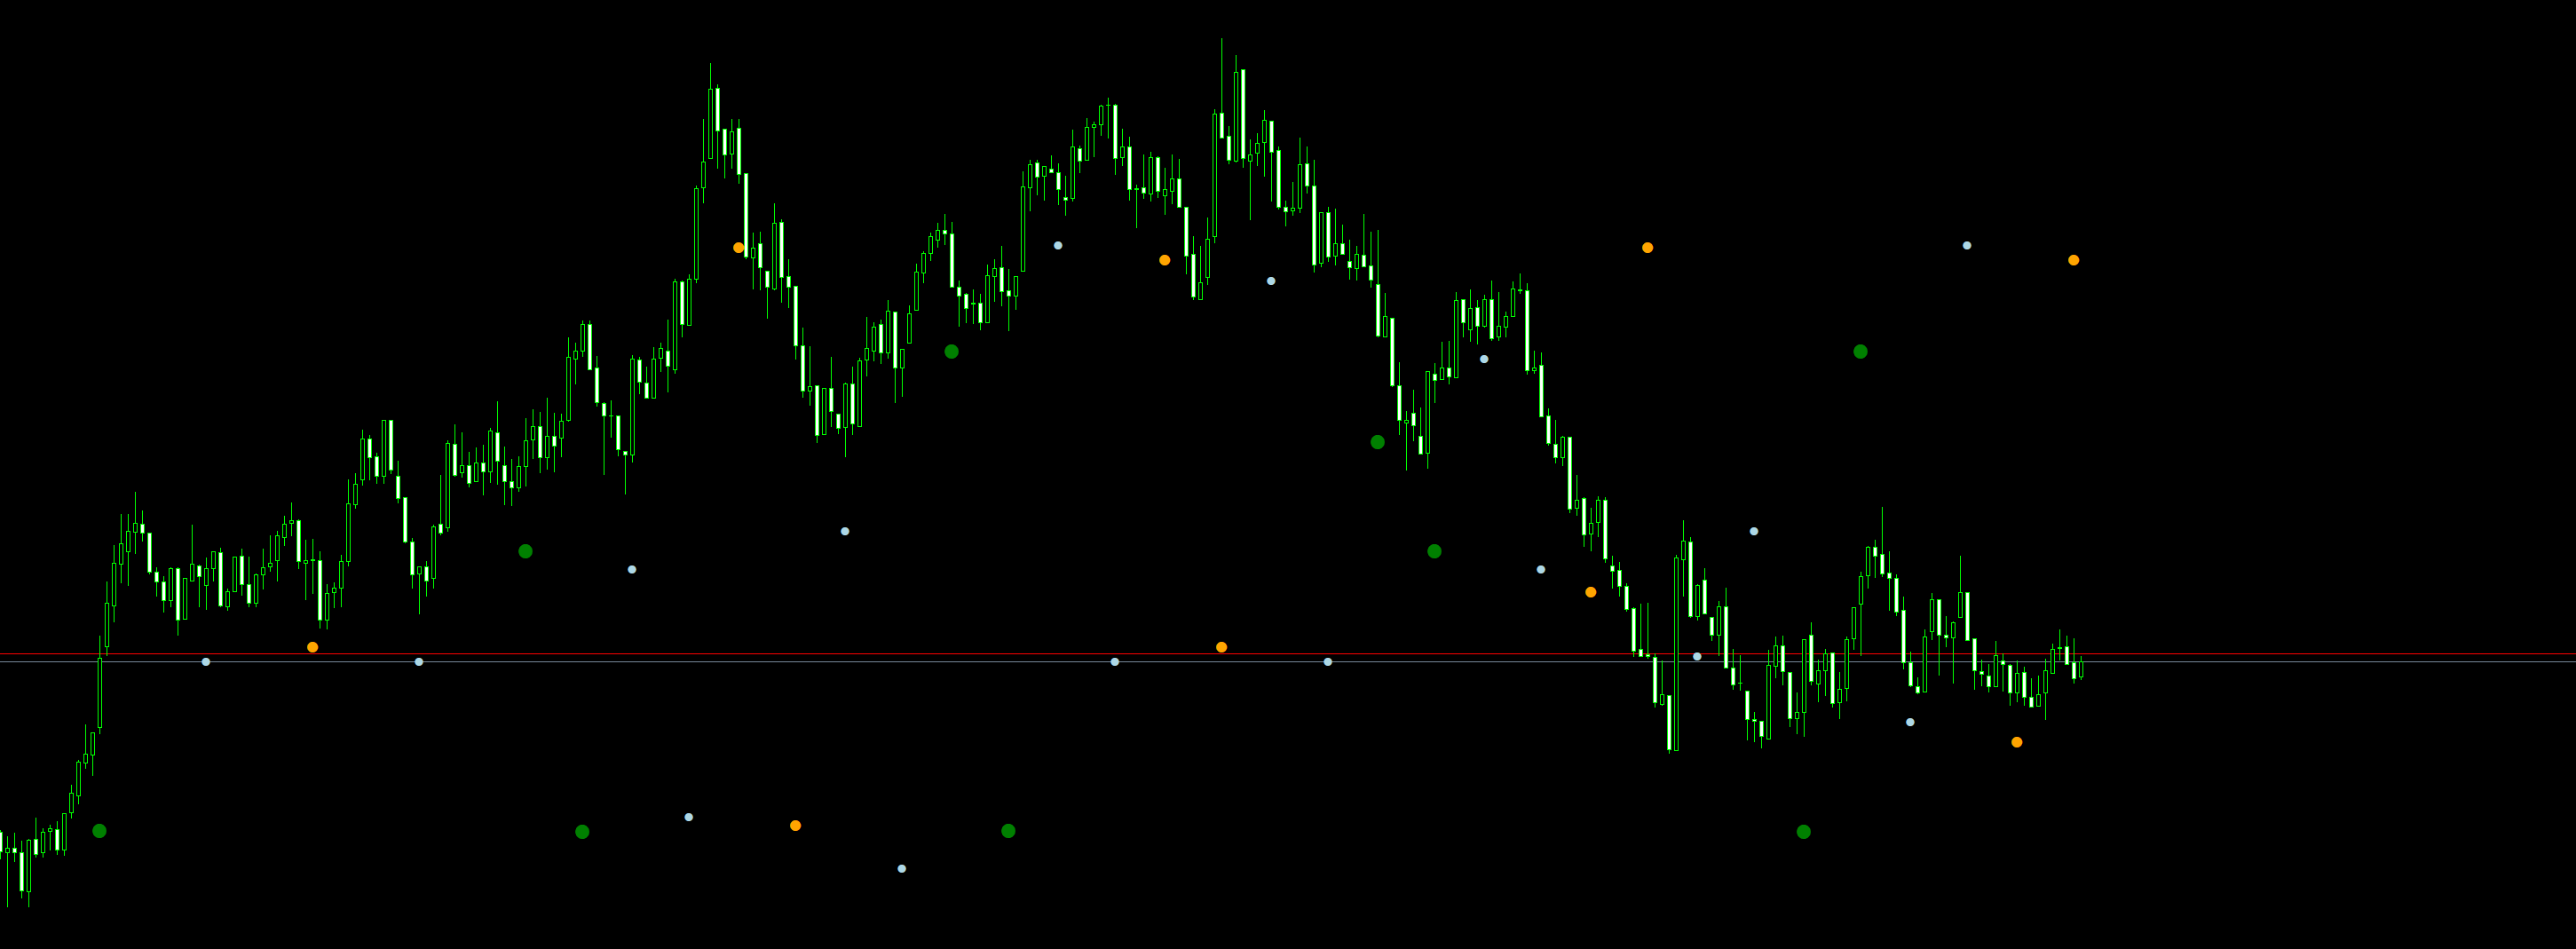
Normally, the dots should be below/above the candles, but as you can see in the attached image, they are in completely different places after deletion.
The indicator ran without issues for hours before the drawing broke.
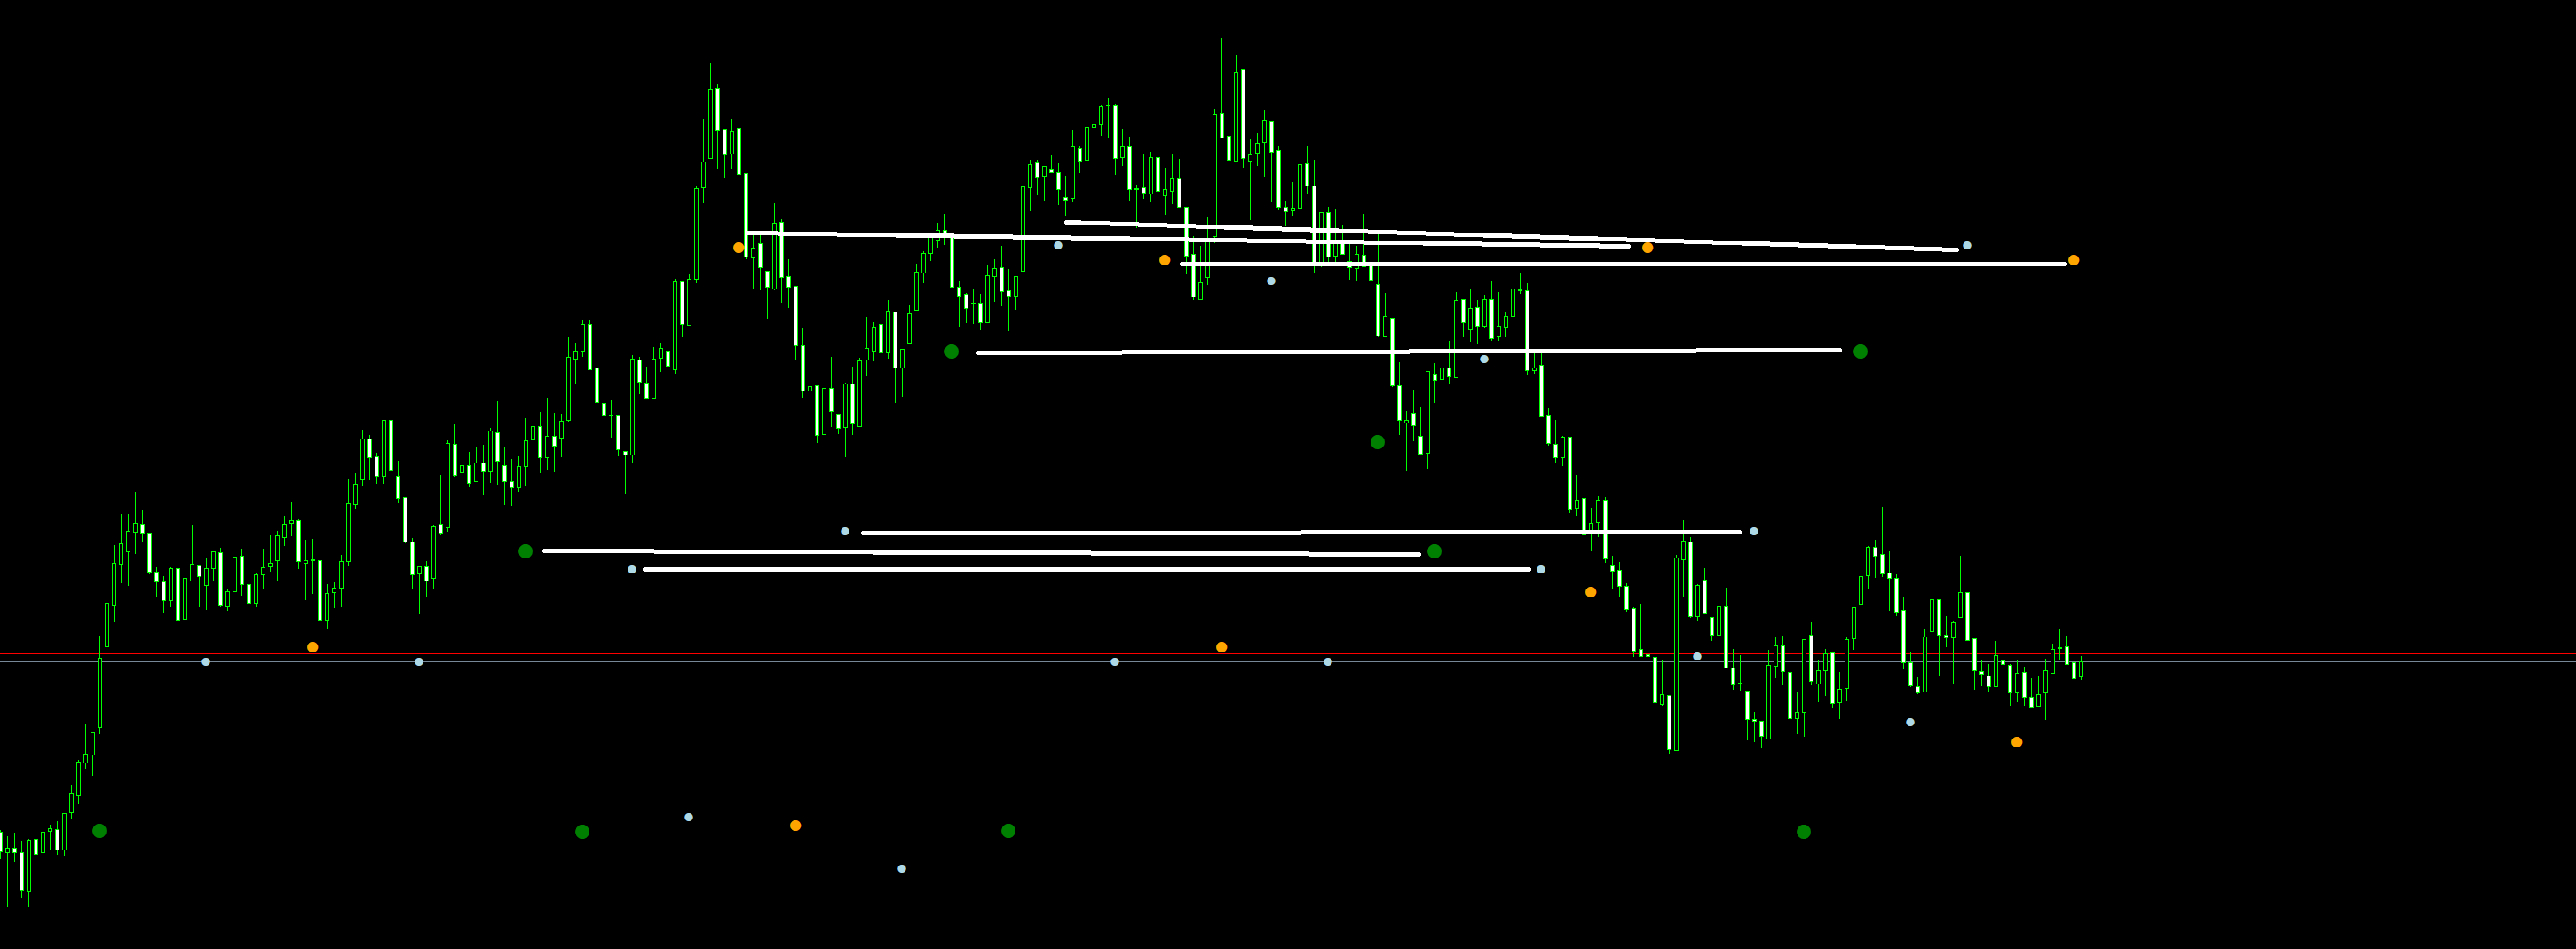
I created another indicator that monitors changes in the number of candles, and it signaled during the breakdown that about 128 candles were deleted, similar to what I measured manually before when observing the shift in signals on the chart.
I'm attaching the full source code of the indicator as well so you can see where the signals should be.
And of course, I'm curious why this indicator is also "broken."
#property strict
#property indicator_chart_window
#property indicator_buffers 3

double buff_a[], buff_b[], buff_c[];
int limit, mins;

int OnInit(){

   SetIndexBuffer(0, buff_a);
   SetIndexStyle(0, DRAW_ARROW, STYLE_SOLID, 1, clrLightBlue);
   SetIndexArrow(0, 108);

   SetIndexBuffer(1, buff_b);
   SetIndexStyle(1, DRAW_ARROW, STYLE_SOLID, 2, clrOrange);
   SetIndexArrow(1, 108);

   SetIndexBuffer(2, buff_c);
   SetIndexStyle(2, DRAW_ARROW, STYLE_SOLID, 3, clrGreen);
   SetIndexArrow(2, 108);

   return(INIT_SUCCEEDED);
}

int OnCalculate(const int rates_total,
                const int prev_calculated,
                const datetime &time[],
                const double &open[],
                const double &high[],
                const double &low[],
                const double &close[],
                const long &tick_volume[],
                const long &volume[],
                const int &spread[]){

   limit = (int)MathMin(Bars - 1, rates_total - prev_calculated);
   for(int index = limit; index > 0; index--){
      mins = TimeMinute(Time[index]);
      if(mins % 60 == 0){
         buff_c[index] = Low[index] - (High[index] - Low[index]);
      }else if(mins % 30 == 0){
         buff_b[index] = Low[index] - (High[index] - Low[index]);
      }else if(mins % 15 == 0){
         buff_a[index] = Low[index] - (High[index] - Low[index]);
      }
   }

   return(rates_total);
}
I’m attaching three images: one shows the correct functionality, another shows the incorrect drawing, and the third highlights which signal shifted while also remaining in its original position.
I created a simple indicator because I don't want to share my original one.
This one also breaks down when candles are deleted from the chart.
Normally, the dots should be below/above the candles, but as you can see in the attached image, they are in completely different places after deletion.
The indicator ran without issues for hours before the drawing broke.
I created another indicator that monitors changes in the number of candles, and it signaled during the breakdown that about 128 candles were deleted, similar to what I measured manually before when observing the shift in signals on the chart.
I'm attaching the full source code of the indicator as well so you can see where the signals should be.
And of course, I'm curious why this indicator is also "broken."
I’m attaching three images: one shows the correct functionality, another shows the incorrect drawing, and the third highlights which signal shifted while also remaining in its original position.
sorry , what do you mean with "deleted from the chart" ?
      if(mins % 60 == 0){
         buff_c[index] = Low[index] - (High[index] - Low[index]);
      }else if(mins % 30 == 0){
         buff_b[index] = Low[index] - (High[index] - Low[index]);
      }else if(mins % 15 == 0){
         buff_a[index] = Low[index] - (High[index] - Low[index]);
      }
Where do you reset those buffers to EMPTY_VALUE when the conditions are not met?
   limit = (int)MathMin(Bars - 1, rates_total - prev_calculated);
   for(int index = limit; index > 0; index--){
      mins = TimeMinute(Time[index]);
      if(mins % 60 == 0){
         buff_c[index] = Low[index] - (High[index] - Low[index]);
      }else if(mins % 30 == 0){
         buff_b[index] = Low[index] - (High[index] - Low[index]);
      }else if(mins % 15 == 0){
         buff_a[index] = Low[index] - (High[index] - Low[index]);
      }
   }
Besides the issue identified by @William Roeder above, also ...
- Don't use Bars or iBars(). Use only rates_total and prev_calculated which are supplied by the OnCalculate() handler.
- Don't use Time[], HIgh[] or Low[]. Use time[], high[], and low[] which are supplied by the OnCalculate() handler.
Don't mix the two concepts. Most of the time there is no issue, but sometimes there is (e.g. Offline charts) and it is programmatically incorrect.
So do your best to always use the parameters passed by the OnCalculate() handler instead of the other functionality.use the iBars function instead of Bars, these are different functions,
The author uses the variable Bars, not the function.
What exactly is the difference between Bars and iBars for the current timeframe?
read the documentation
https://docs.mql4.com/series/ibars
iBars
Note
For the current chart, the information about the amount of bars is in the Bars predefined variable.
When this happens, the platform simply shifts the already drawn signals 128 candles to the right, as you can see in my image.
I don’t understand what iBars() / Bars has to do with this, as they suggest below. It’s only there to ensure the limit doesn’t exceed the maximum candle count.
Personally, I have never seen that problem before when the buffers are properly calculated.
However, as a precaution, monitor the rates_total variable, and when it decreases, consider rebuilding the buffers.
There is no need. Use only the rates_total variable and OHLC data provided by the OnCalculate() handler. Don't use any outside data if possible. Read my previous post #6. If you do this you should not have any issues with the previous point you mentioned.
Besides the issue identified by @William Roeder above, also ...
- Don't use Bars or iBars(). Use only rates_total and prev_calculated which are supplied by the OnCalculate() handler.
- Don't use Time[], HIgh[] or Low[]. Use time[], high[], and low[] which are supplied by the OnCalculate() handler.
Don't mix the two concepts. Most of the time there is no issue, but sometimes there is and it is programmatically incorrect.
So do your best to always use the parameters passed by the OnCalculate() handler instead of the other functionality.Excuse me, but the predefined Time[], Low[],High[] etc. arrays are just as much a part of the programming language as the low[] array received in the parameter list.
There’s no 'deprecated' label next to them in the documentation, so why their its use not recommended?
I'll replace the array references and see if that solves the problem.
Here is the link to the documentation for the Time[] array: http://docs.mql4.com/predefined/time
- Free trading apps
- Over 8,000 signals for copying
- Economic news for exploring financial markets
You agree to website policy and terms of use
Hello everyone,
I'm looking for a solution to the following MQL4 issue. I wrote an indicator that draws histograms in the chart window. I noticed that when the chart reaches the specified candle count limit, it still draws an additional 128 candles and then deletes the oldest 128 candles to return to the set limit. When this deletion happens, the system shifts the histograms drawn on the older candles by 128 candles, which causes the indicator's display to become inaccurate.
Do you have any ideas on how to solve this?
I'll attach an image showing the issue.
As you can see, the same series of histograms appears again, shifted 128 candles to the right, and the arrows also appear with this offset.
Thanks in advance!