Discussing the article: "Gain an Edge Over Any Market (Part III): Visa Spending Index"
Thank you, Gamu
Great article, thanks for sharing!!
Thank you again Gamu. Well written as usual . A great commented template on how to visualize, scale, test, check for overfitting, implement a datafeed ,predict and implement a trading system from a dataset . Fantastic much appreciated
linfo2 #:
Thank you again Gamu. Well written as usual . A great commented template on how to visualize, scale, test, check for overfitting, implement a datafeed ,predict and implement a trading system from a dataset . Fantastic much appreciated
Thank you Neil for your feedback, it's great to hear such kind words.Thank you again Gamu. Well written as usual . A great commented template on how to visualize, scale, test, check for overfitting, implement a datafeed ,predict and implement a trading system from a dataset . Fantastic much appreciated
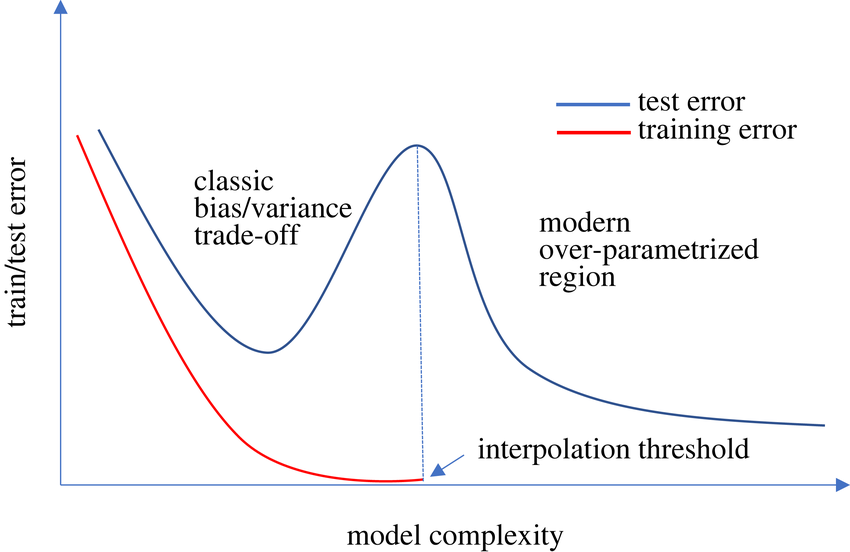
The crazy thing is that, everyday there's new research that questions everything we thought we knew. I've recently learned about the double descent phenomenon.
If the theory is true, there's no such thing as overfitting. According to the phenomenon, if we continued training larger deep neural networks for longer periods on the same training set, the validation error will continue falling to lower and lower levels my nigga.
The image I attached below expresses the phenomenon visually. The catch is that, training a model that large for that long is expensive, and furthermore if the data is noisy the phenomenon takes longer. I haven't been able to reproduce the results on my computer however this paper is making rounds
You are missing trading opportunities:
- Free trading apps
- Over 8,000 signals for copying
- Economic news for exploring financial markets
Registration
Log in
You agree to website policy and terms of use
If you do not have an account, please register
Check out the new article: Gain an Edge Over Any Market (Part III): Visa Spending Index.
In the world of big data, there are millions of alternative datasets that hold the potential to enhance our trading strategies. In this series of articles, we will help you identify the most informative public datasets.
VISA is an American multinational payment services company. It was founded in 1958, and today the company operates one of the largest transactions processing networks in the world. VISA are well positioned to be a source of reputable alternative data because they have penetrated almost every market in the developed world. Furthermore, the Federal Reserve Bank of St. Louis also collect some of their macroeconomic data from VISA.
In this discussion, we’re going to analyze the VISA Spending Momentum Index (SMI). The Index is a macroeconomic indicator of consumer spending behavior. The data is aggregated by VISA, using their proprietary networks and branded VISA debit and credit cards. All the data is depersonalized and is mostly collected in the United States. As VISA continues to aggregate data from different markets, this index may eventually become a benchmark of global consumer behavior.
We will use an API service provided by the Federal Reserve Bank of St Louis to retrieve the VISA SMI datasets. The Federal Reserve Economic Database (FRED) API allows us to access hundreds of thousands of different economic time series data that have been collected from across the world.
Author: Gamuchirai Zororo Ndawana