Discussing the article: "Angle-based operations for traders"
Firstly, there is a convenient free tool for MT4 for building angles according to Gann . https://wdfiles.ru/Mvrm.
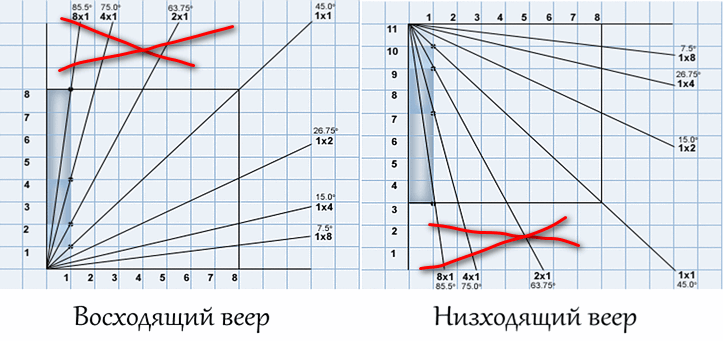
Secondly - Gann has written in detail what criteria are used to build angles. Three types of quadrature.
Alexey, how would the angle calculation look like for only one instrument?
For example, between two pairs you have a calculation like this:
double x=open[p]/_Point,
y=iOpen(SecSymbol,PERIOD_CURRENT,p)/point,
r=MathSqrt(x*x+y*y);
so X and Y here are two prices.
For one instrument, how will the angle calculation look like, according to your description at the beginning of the article?
Can you also write the code briefly?
Alexei, what would the angle calculation look like for only one tool?
For example, between two pairs, your calculation is like this:
double x=open[p]/_Point,
y=iOpen(SecSymbol,PERIOD_CURRENT,p)/point,
r=MathSqrt(x*x+y*y);
so X and Y here are two prices.
For one instrument, what would the angle calculation look like according to your description at the beginning of the article?
Can you also write the code briefly?
At first glance, two variants are possible. 1st - analogue of Lamerey's ladder, i.e. we check possible connection of the current angle with previous values with some shift. 2nd - how much the current angle depends on previous price changes
Gunn's angles made my eyes water.)
Firstly, I'm not drawing these angles.
They will easily work themselves out if the vertical axis is continued further.
Secondly, I will use the standard deviation as the vertical unit, and the median price as the axis. It turns out roughly like this.
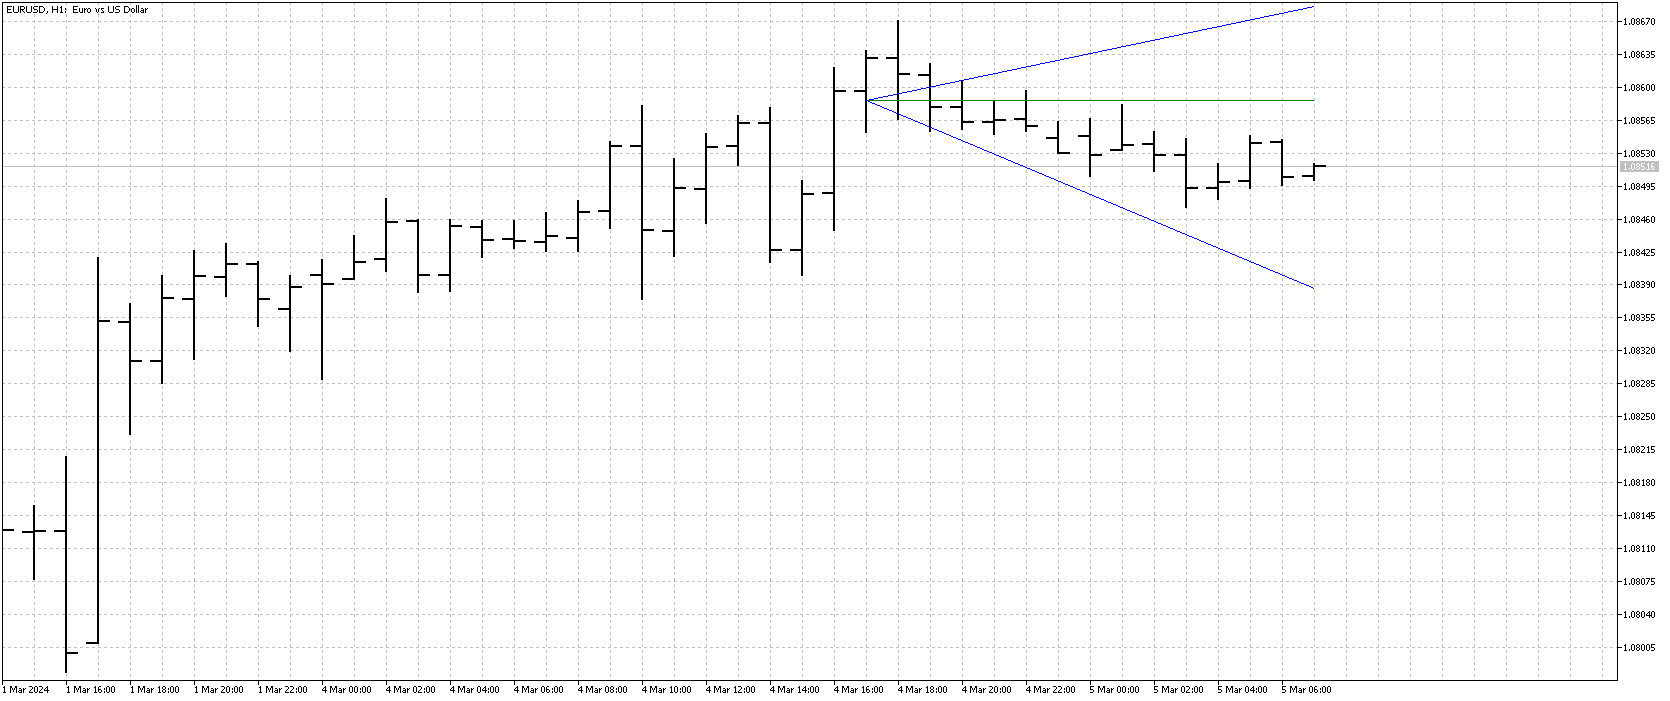
Instead of a square, we get a rectangle. And the corners show (approximately) the boundaries of Brownian price movement.
Gunn's angles made my eyes water.)
First of all, I'm not drawing these corners.
They will easily appear on their own if the vertical axis is continued further.
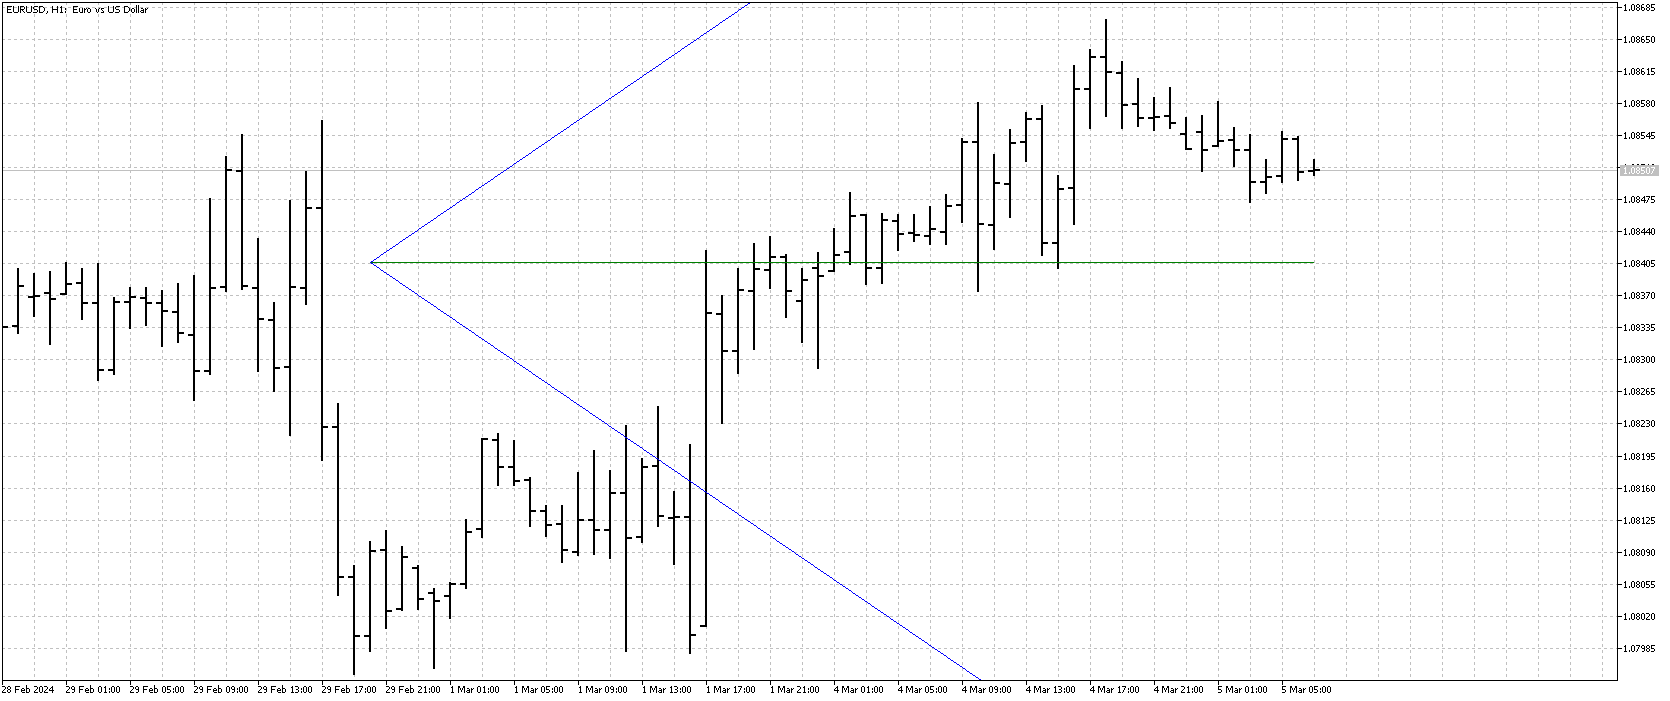
Secondly, I will use the standard deviation as the vertical unit, and the median price as the axis. The result is something like this.
Instead of a square, we have a rectangle. And the corners show (approximately) the boundaries of Brownian price movement.
I see. I am too lazy to figure out why exactly such angles are used and what angles are missing. And how they are correctly plotted on the chart.
Good luck in inventing your own non-riding lissaped! :)
Gunn's angles made my eyes water.)
First of all, I'm not drawing these corners.
They will easily appear on their own if the vertical axis is continued further.
Secondly, I will use the standard deviation as the vertical unit, and the median price as the axis. The result is something like this.
Instead of a square, we have a rectangle. And the corners show (approximately) the boundaries of Brownian price movement.
Well.
interesting approach
- Free trading apps
- Over 8,000 signals for copying
- Economic news for exploring financial markets
You agree to website policy and terms of use
Check out the new article: Angle-based operations for traders.
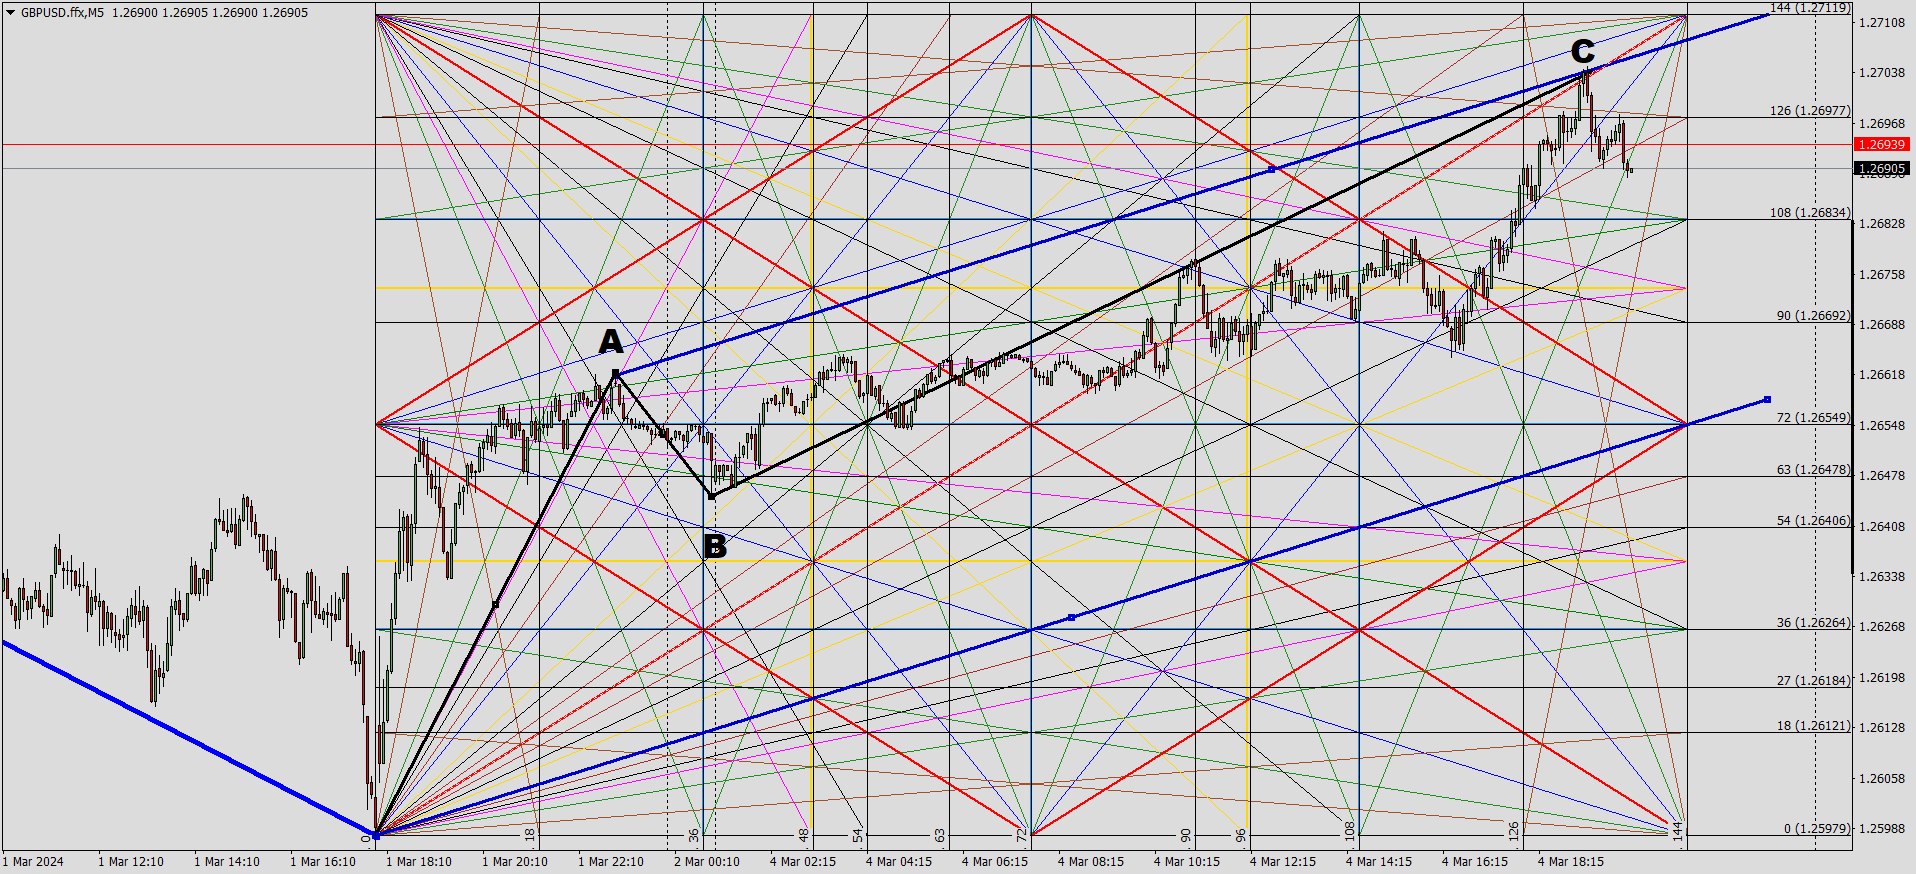
This article will cover angle-based operations. We will look at methods for constructing angles and using them in trading.
Angle-based operations have been used in trading for a very long time. The main advantage of these operations is the simplicity of constructing angles and their clarity. A striking example of angle-based operations are Gann tools.
It would seem that everything about angles is already known. But I will try to look at the angles from a different perspective. Let's try to remember the well-forgotten old things in order to get something completely new.
Author: Aleksej Poljakov