These are the indicators/oscillators I use
1001+ indicators out there. All great, awesome and wonderful, all work to some extent, but all are lagging, with four exceptions.
4 leading indicators (non-lagging)
-- Divergence
-- Gartley harmonics/patterns
-- Fibonacci sequence
-- Elliott waves
1001+ indicators out there. All great, awesome and wonderful, all work to some extent, but all are lagging, with four exceptions.
4 leading indicators (non-lagging)
-- Divergence
-- Gartley harmonics/patterns
-- Fibonacci sequence
-- Elliott waves
Very old theories... if these indicators would work, everybody would be reach. Do not start your trading journey with these, it is a wrong start for sure. At some point in trading of course they are useful but you need to learn analyzing price action first. Also I found divergences in CCI with long periods like 80-100 does a good job.
Also you may wish to have a look this blog post:
- www.mql5.com
Very old theories... if these indicators would work, everybody would be reach. Do not start your trading journey with these, it is a wrong start for sure. At some point in trading of course they are useful but you need to learn analyzing price action first. Also I found divergences in CCI with long periods like 80-100 does a good job.
Also you may wish to have a look this blog post:
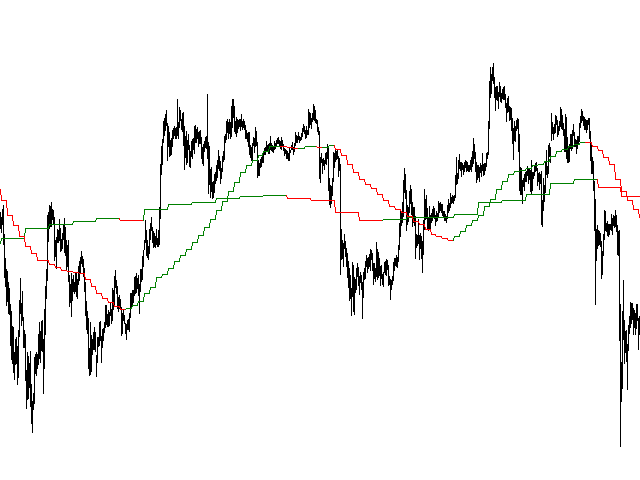
I am in the process of making indicators that work on higher timeframes to be able to exploit their information on lower timeframes
example with moving averages, but I should be able to do it with all indicators
BB, RSI etc.
- Free trading apps
- Over 8,000 signals for copying
- Economic news for exploring financial markets
You agree to website policy and terms of use
Hello everyone,
In my daily trading, I always apply Bollinger Bands, RSI, MACD, Pivot Point, and supports and resistances calculated from the pivot.
I have found that on EUR/GBP and GBP/USD, they provide me with a fairly accurate picture.
Do you also use these tools or do you use others? Is there any useful indicator that you would recommend?