Stop loss: near or far?
You place the stop where it needs to be — where the reason for the trade is no longer valid. E.g. trading a support bounce, the stop goes below the support. Then you compute your lot size.
Has anyone here ever achieved real results using the classic risk/reward strategy of 1:2 / 1:3 / 1:5 or similar?
Personally, from all the tests I've conducted over the years, I'm finding that the best strategy isn't necessarily to set the TP at a return that's at least double the SL, but to think in a completely different way, namely, to place the SL very far and the TP closer.
I trade EUR/GBP and GBP/USD by placing the SL at 1500 pips for EUR/GBP and at 2500 pips for GBP/USD. Then, after reaching about 80 pips of profit, I activate a trailing stop.
The strategy, combined with other risk measures, is proving to be profitable.
Which school do you belong to? Close SL and far TP? Or far SL and close TP?
As long as the trade entry points are good, you would not need to place SL by a large distance. But overall, you need to be very careful on placing orders and being 'selective'. When you SL 1500 pip, it will erase your 20 positions those you closed in profit. Erase half, 10. But even 10 position is too much to lose by a single SL!!! Therefore, you need to wait for quality trade setups and ideally avoid using above the ratio of 1:4.
Please have a look at this blog post I have published yesterday:
- www.mql5.com
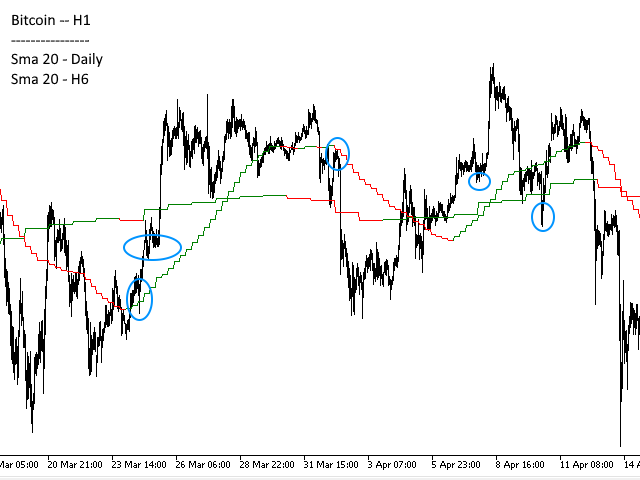
Here's an image that might illustrate my thinking about the potential entries circled
As you know, prices only make successive waves.
It is highly likely that one of these waves will have a stronger extreme so we can take advantage
If we manage to detect this extreme, the stop can be very tight. If the price goes to an extreme, there is little chance that it will do better
After the theoretical TP remains to be fixed, but once again the opposite extreme, or the last highest/lowest done can be used
As you can definitely see, the RRs are strong
The system used is very simple and should be further strengthened but the basis is just two MM SMA of 20 periods coming from two different time frames, the daily and h6 seen on the h1

Good morning
Yes absolutely, you are right especially since I did not code the EA so we cannot say that I have completely covered the problems.
However, I remain a developer, and if I coded these average timeframes, it is because I had an idea in mind, even several...
To answer your question about the red squares, there is practically no chance that I will try to get into them, because I am a trend follower and the red squares are clearly against the trend and therefore I have no proposal , nor reflection...
On the other hand, when it came to my circles, it wasn't as arbitrary.
I'm not going to go into too much detail but let's say that if I "see" the values and the direction of the daily SMA, and I look at the H1, in theory that makes 24 bars and on these 24 bars there must be have a possibility of launching a scenario.
The SMA on the H6 allows you to have a small confirmation of the trend
If you look closely, and if I didn't make a mistake in putting the circles.
The two averages are of the same orientation (color) and at the start of the trend, that is to say that the price is below or between the two MAs for the long
Whether the price is above or between the two MM for shorts
The circles were then placed on what could be a pull-back, which are easier to find on the long ones than on the shorts
As you can see, "concrete terms" are not very hard to formulate
Wonderful evening
Ps I just saw that the penultimate circle does not meet the terms.... it is above the 2 MM green
You place the stop where it needs to be — where the reason for the trade is no longer valid. E.g. trading a support bounce, the stop goes below the support. Then you compute your lot size.
Many times the price doesn't bounce off the support in one touch, it shows some bounce in first touch then takes some further dips and then really bounces off the support. If you trade the first bounce mostlikely your stop will get triggered. How do you place the stop in such cases?
If you trade the first bounce mostlikely your stop will get triggered. How do you place the stop in such cases?
Good morning
I agree
But I think it still remains a subject of several questions
Personally
A trade is a scenario.
We must qualify a level, let's say remarkable.
Remarkable in what sense? Rise or fall? The rise is more broken down than the decline
The rebound, the rebounds are obligatory and they must serve to qualify the remarkable level. if there is no movement around this level, it is not noticed.
If it is broken upwards, it is unlikely that the price will leave without a pull-back, what you called
If the SL is placed on the lowest before breaking the level, it will be very close. This stop level must also be characterized
If the scenario is valid for the rise, the SL should not be affected, because if it is, the scenario was not valid.
- Free trading apps
- Over 8,000 signals for copying
- Economic news for exploring financial markets
You agree to website policy and terms of use
Has anyone here ever achieved real results using the classic risk/reward strategy of 1:2 / 1:3 / 1:5 or similar?
Personally, from all the tests I've conducted over the years, I'm finding that the best strategy isn't necessarily to set the TP at a return that's at least double the SL, but to think in a completely different way, namely, to place the SL very far and the TP closer.
I trade EUR/GBP and GBP/USD by placing the SL at 1500 pips for EUR/GBP and at 2500 pips for GBP/USD. Then, after reaching about 80 pips of profit, I activate a trailing stop.
The strategy, combined with other risk measures, is proving to be profitable.
Which school do you belong to? Close SL and far TP? Or far SL and close TP?