Any way to draw a rectangle in the onCalculate function?
Hi
I think you need to find a freelancer who will code this for you. Or show us here your own attempts of trying to code this script so we can help you with this.
I can only say that you can modify this code to create objects at the places where indicator place the arrows) and then code another script where you detect if those new objects arrows are clicked:
OnChartEvent has included detection of clicked objects (you can differentiate what was clicked by color detection)
Best Regards
Arrow buffers are not arrow objects, you can't click or select them.
Oh I see, so first, I need to "map" my arrows, using an object, and then I need to detect the click on it, thanks for the reply, will try it out
You are missing trading opportunities:
- Free trading apps
- Over 8,000 signals for copying
- Economic news for exploring financial markets
Registration
Log in
You agree to website policy and terms of use
If you do not have an account, please register
I'm looking to edit this code to be able to draw a rectangle between the 261.8 and the 423.6 fibo levels when an arrow is clicked.
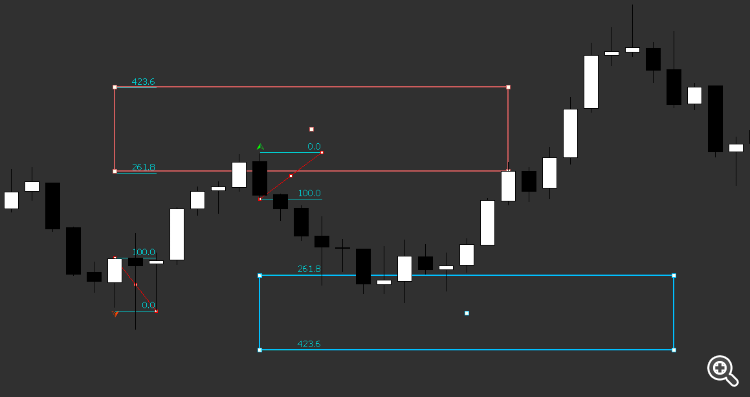
here are the final result that i want to achieve, red rectangle for the red arrow and blue rectangle for the green arrow:
and this is the code of the arrows indicator: