Discussing the article: "Color buffers in multi-symbol multi-period indicators"
Artem hi! How to add your own indicator? I can't do it! I must be doing something wrong?! If there was an example... step by step through the code and it would be clear! But he immediately!... error of indicator creation... OnInit return code is -1... Help in general, please!
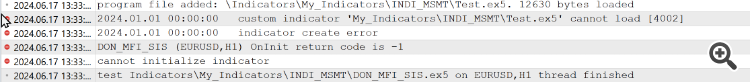
  MqlParam mql_params[];
   ArrayResize(mql_params, 2);

   mql_params[0].type          = TYPE_STRING;
   mql_params[0].string_value  = "My_Indicators\\INDI_MSMT\\Test";
//---
   mql_params[1].type          = TYPE_INT;
   mql_params[1].integer_value = 10;

   handle_ind2 = indicators.AddNewCustom(NULL, PERIOD_CURRENT, "My_Indicators\\INDI_MSMT\\Test.ex5", "DON_MFI_SIS", 1, mql_params);

//handle_ind1 = IndicatorCreate(NULL, PERIOD_CURRENT, IND_CUSTOM, 1, mql_params);
From the picture it is difficult to understand what you are doing wrong there. Please attach the code that does not work together with the custom indicator you are using.
Your library was not changed in any way, I just copied it... The test was just made to test on one buffer, I don't quite understand how all this will work when you have 20 of them! Anyway step by step!.... thanks!
Your library was not changed in any way, I just copied it... the test was just made to test on one buffer, I don't quite understand how all this will work when you have 20 of them! Anyway, step by step!.... thanks!
Looked at your codes. Where is the working custom indicator? There is just a dummy with one non-coloured buffer. Most likely you need this article: https://www.mql5.com/ru/articles/13578. It has everything for working with one-colour custom indicators.

- www.mql5.com
I looked at your codes. Where is the working custom indicator? There is just a dummy with one non-coloured buffer. Most likely, you need this article: https://www.mql5.com/ru/articles/13578. It has everything for working with one-colour custom indicators.
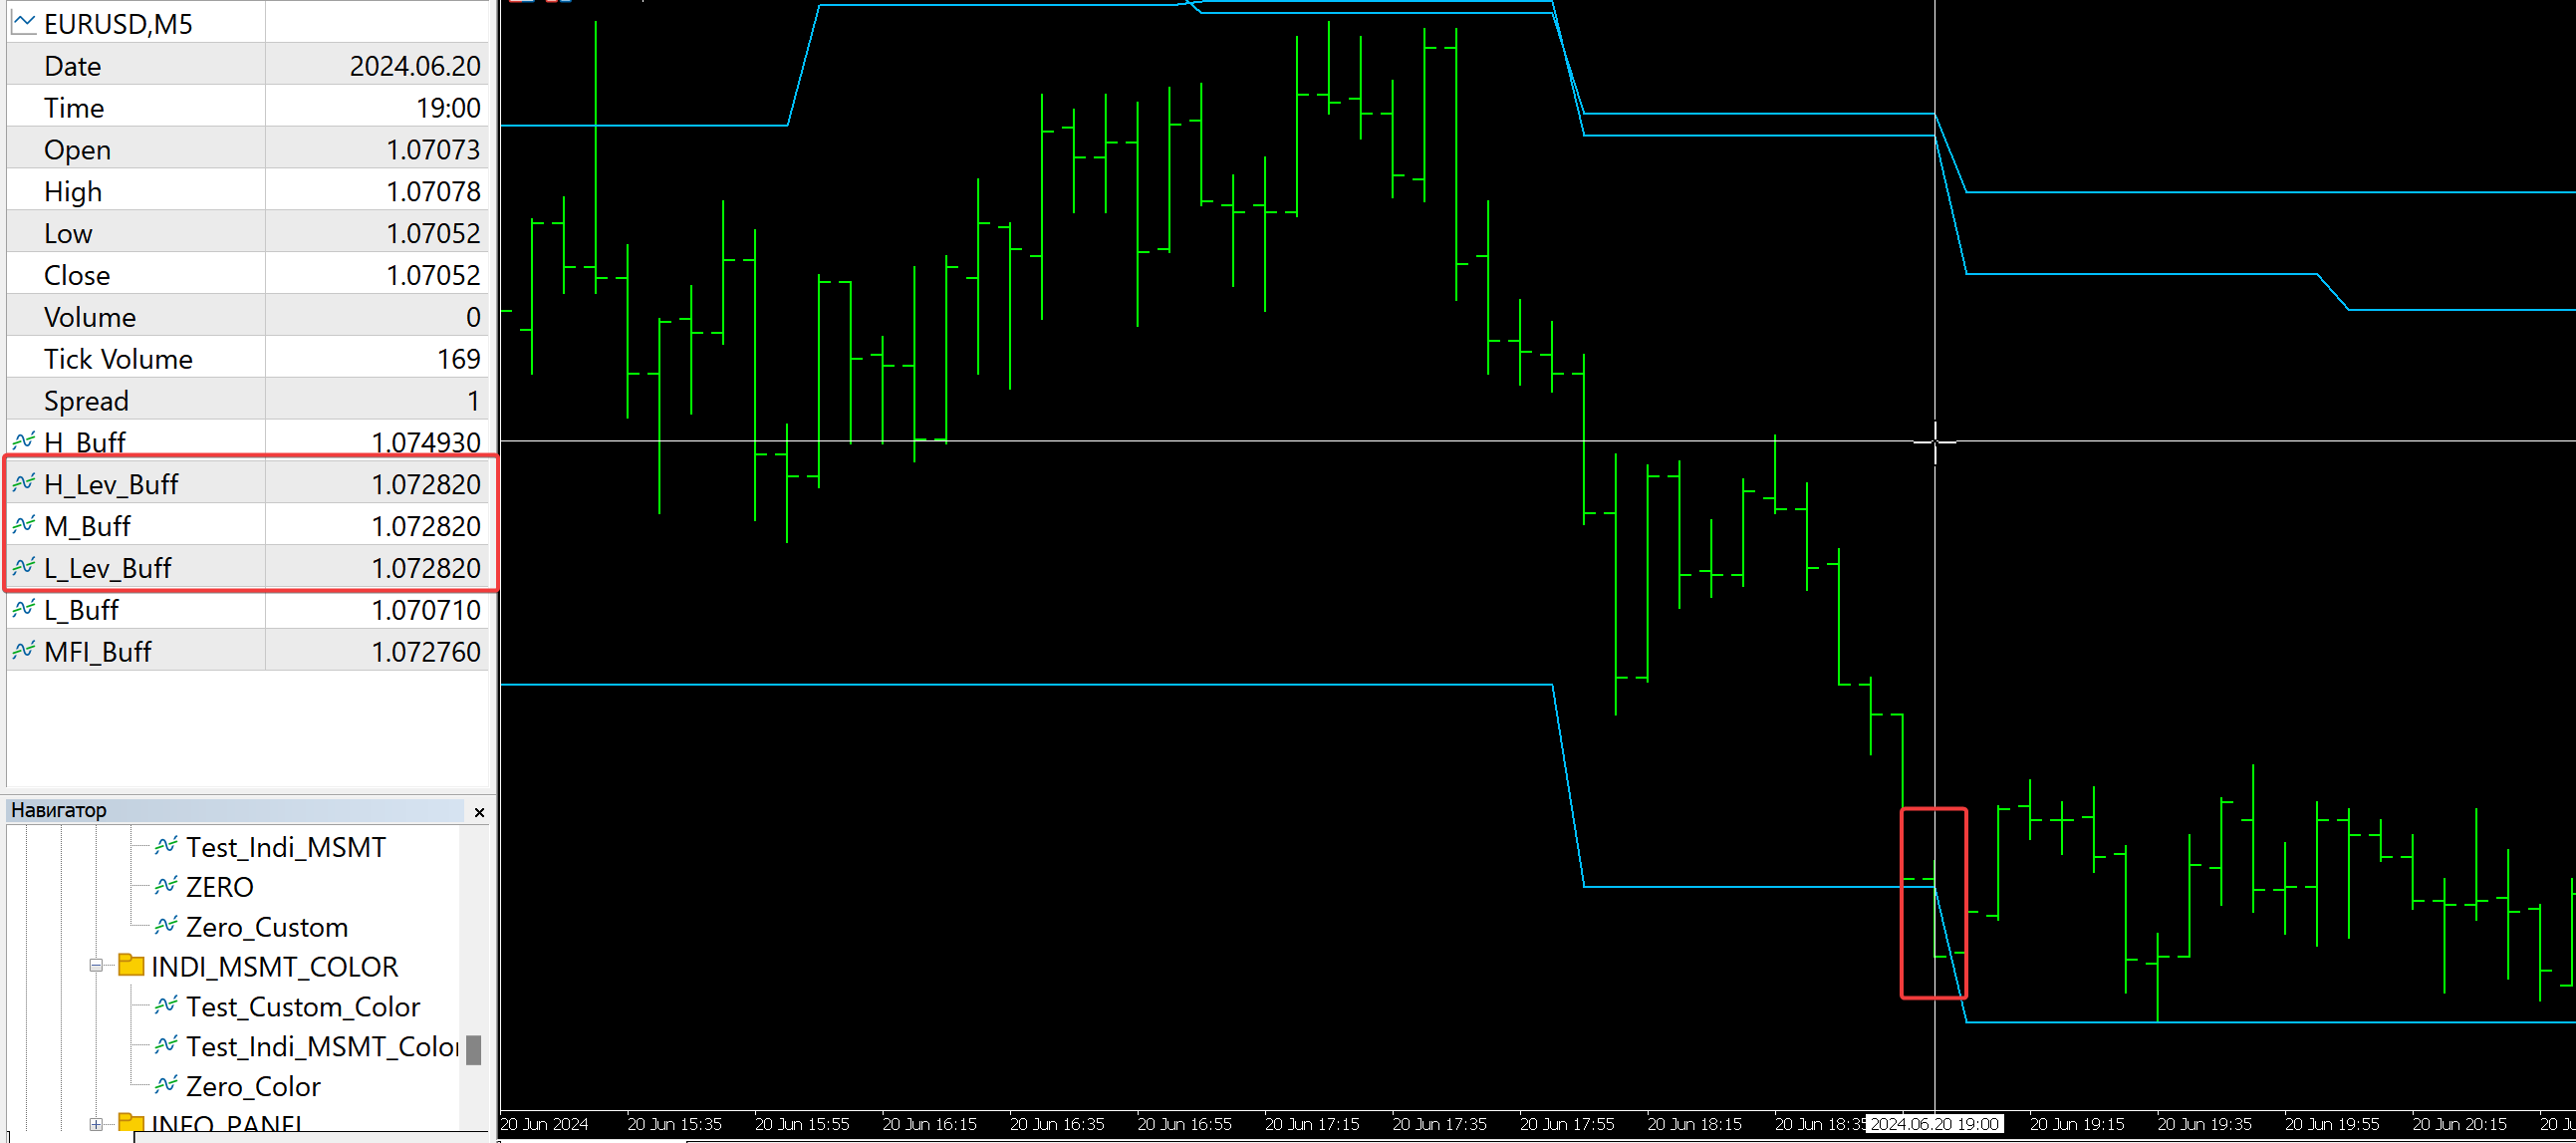
Artem hi, thanks for looking at it! I got it working with non-coloured buffers, but it's a bit tentative... for some reason it takes a long time to load... maybe Sunday? Do you need history? When you reboot the terminal, does it draw at once? On the photo in the frame three buffers have the same value, it should not be so. Offset by one bar, also in the frame. With coloured ones it's a problem... Nothing loads at all! Can you take a look? Thanks!
If the data is not received, the indicator simply exits OnCalculate() with the return of zero value, which is equal to the indication that it has not been calculated yet, and on the next tick it will try to receive data again. In this case, the first access to the required but not received data starts the process of paging this data.
If the data is not received, the indicator simply exits OnCalculate() with the return of zero value, which is equivalent to an indication that it has not been calculated yet, and on the next tick it will try to receive data again. In this case, the first access to the required but not received data starts the process of paging this data.
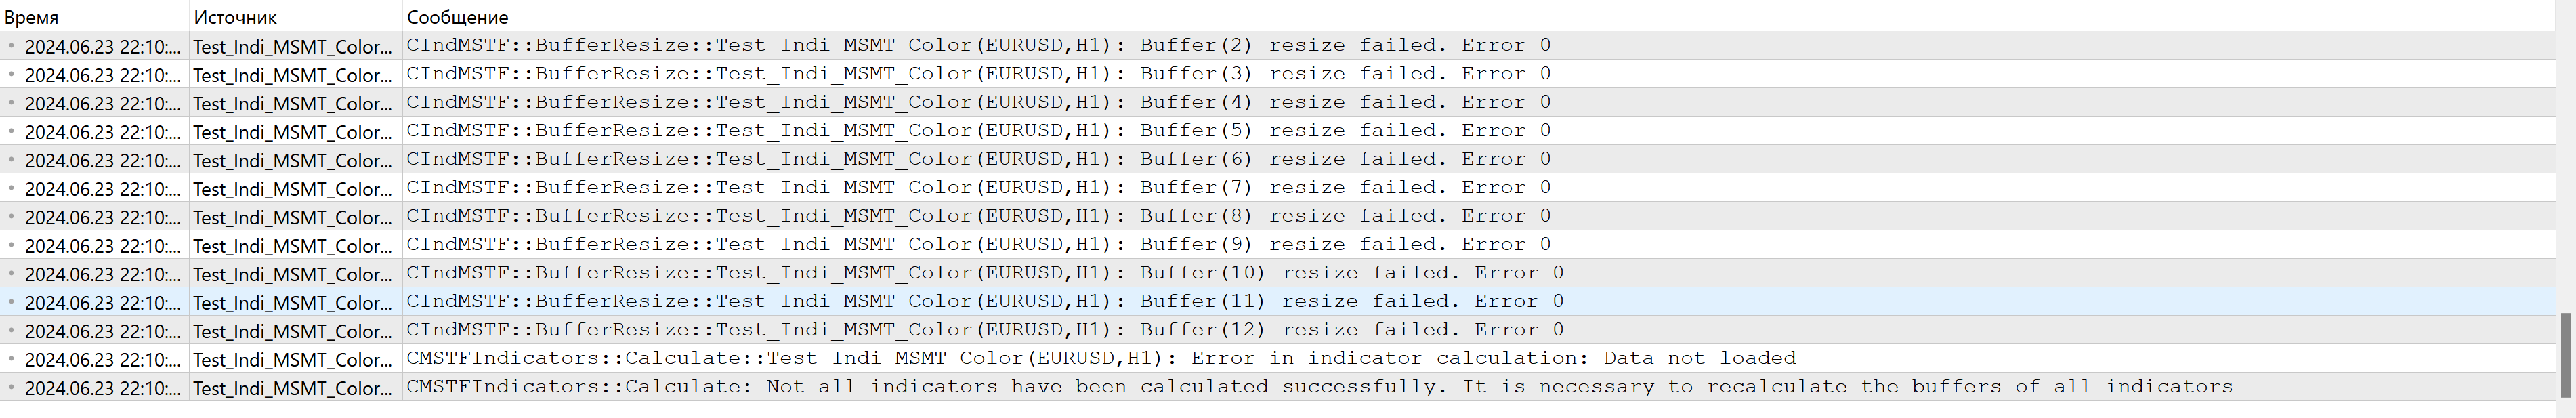
Why this problem does not occur when the terminal is restarted? Everything is drawn at once! It occurs when switching to another TF... and sometimes this"array out of range in 'INDI_MSMT_!.mqh' (680,51)" always has enough size, and sometimes not.... it's a mystery to me!
Yesterday I attached 'INDI_MSMT_!.mqh' the very first ...
- Free trading apps
- Over 8,000 signals for copying
- Economic news for exploring financial markets
You agree to website policy and terms of use
Check out the new article: Color buffers in multi-symbol multi-period indicators.
In this article, we will review the structure of the indicator buffer in multi-symbol, multi-period indicators and organize the display of colored buffers of these indicators on the chart.
Based on the above, we understand that
For a better understanding, let's create a new indicator in which we will indicate several plotting buffers, including simple and colored, using multiple arrays for construction:
Author: Artyom Trishkin