Help, i'm trying to create a custom indicator that overlays an M3 line chart onto M1
Hello all, i'm new here, as the title says, (MT5) i'm trying to overlay an M3 line-chart onto an M1 line-chart by creating a custom indicator that uses M1 as the data source, however i've run into lots of problems, nothing gets draw even after initializing my buffers, any pointers in the right directions will be greatly appreciated:
Thank you for your reply, I've added some debug lines on the code: the correct data is added to the buffer correctly, i've matched it to accurate points on the M3 line-chart, how ever no chart is being drawn, if i uncomment this two lines
//ArraySetAsSeries(time,true); don't know how this affects my code'
   //ArraySetAsSeries(close,true);
then the line is drawn in reverse but that is incorrect, this was my logic:
1. if history data is available, from the oldest to the latest data, check if the minute component of the time[] series is a multiple of three, if so add it to the M3buffer, repeat that to the current price else {current market data}, wait till a time[0] is a multiple of 3 and add to the buffer
2. this buffer is then drawn on the chart
3. can you spot any error, the debug Prints shows that i'm getting the right data points but the issue could be alignment, i'm just confused.
//+------------------------------------------------------------------+
//|                                                   M3_Overlay.mq5 |
//|                        Copyright 2024, MetaQuotes Software Corp. |
//|                                              https://www.mql5.com |
//+------------------------------------------------------------------+
#property indicator_chart_window
#property indicator_buffers 1
#property indicator_plots   1

#property indicator_type1   DRAW_LINE
#property indicator_color1  clrGreen
#property indicator_style1  STYLE_SOLID
#property indicator_label1  "M3 Overlay"
#property indicator_width1  2

//--- indicator buffers
double M3Buffer[];
const  int MinuteCounter=3;
int    buffIndex  = 0;
static bool addOnClose = false;
//+------------------------------------------------------------------+
//| Custom indicator initialization function                         |
//+------------------------------------------------------------------+
int OnInit()
{
   //--- indicator buffers mapping
   SetIndexBuffer(0, M3Buffer, INDICATOR_DATA);
   //PlotIndexSetDouble(0,PLOT_EMPTY_VALUE,0);
   //---
   return(INIT_SUCCEEDED);
}

//+------------------------------------------------------------------+
//| Custom indicator iteration function                              |
//+------------------------------------------------------------------+
int OnCalculate(const int rates_total,
                const int prev_calculated,
                const datetime &time[],
                const double &open[],
                const double &high[],
                const double &low[],
                const double &close[],
                const long &tick_volume[],
                const long &volume[],
                const int &spread[])
{
   ArraySetAsSeries(M3Buffer,true);//seems to work
   static bool firstRun = true;

   if(firstRun){
      firstRun = false;
      initBuffer(M3Buffer,time,close,buffIndex);
   }
   else{
      addOnce(M3Buffer,close);
   }

   //--- return value of prev_calculated for next call
   return (rates_total);
}
//+------------------------------------------------------------------+


bool isMultipleMins(int seg,datetime timeparam=0){
  MqlDateTime mTime;

  if(timeparam == 0){
     timeparam = TimeCurrent();
  }

  TimeToStruct(timeparam,mTime);
  int minute = mTime.min + 1;

  return minute % seg == 0;
}

void addOnce(double &buffer[],const double &close[]){
   bool isMulti = isMultipleMins(MinuteCounter);

   if(isMulti && !addOnClose){
       addOnClose = true;
       return;
   }

   if(addOnClose && !isMulti){
      addOnClose = false;
      buffer[buffIndex] = close[1];
      Print("value: ",buffer[buffIndex]," index: ",buffIndex);//for debug
   }
}

void initBuffer(double &buffer[],const datetime &time[], const double &close[],int &buffIndx){
   int arrsz = ArraySize(time);
   //ArraySetAsSeries(time,true); don't know how this affects my code'
   //ArraySetAsSeries(close,true);

   if(arrsz > 0){
      for(int indx = 0; indx < arrsz; indx++){
          if(isMultipleMins(MinuteCounter,time[indx])){
             buffer[buffIndx] = close[indx];
             buffIndx++;
             Print("index: ",buffIndx-1," val: ",buffer[buffIndx-1]);//for debug
          }
      }
   }
}

- 2024.04.02
- www.mql5.com
I'm thinking you're heavily overcomplicating things. You should be able to do something with CopySeries
#property version   "1.00"

#property indicator_chart_window
#property indicator_buffers 2
#property indicator_plots   2

#property indicator_label1  "M1 Line Chart"
#property indicator_type1   DRAW_LINE
#property indicator_color1  clrGray
#property indicator_style1  STYLE_SOLID
#property indicator_width1  1

#property indicator_label2  "M3 Line Chart"
#property indicator_type2   DRAW_LINE
#property indicator_color2  clrRed
#property indicator_style2  STYLE_SOLID
#property indicator_width2  1


double buf_a[];
double buf_b[];

//+------------------------------------------------------------------+
//| Custom indicator initialization function                         |
//+------------------------------------------------------------------+
int OnInit()
  {
   SetIndexBuffer(0, buf_a, INDICATOR_DATA);
   SetIndexBuffer(1, buf_b, INDICATOR_DATA);

   ArraySetAsSeries(buf_a,true);
   ArraySetAsSeries(buf_b,true);

   return(INIT_SUCCEEDED);
  }
//+------------------------------------------------------------------+
//| Custom indicator iteration function                              |
//+------------------------------------------------------------------+


int OnCalculate(const int rates_total,
                const int prev_calculated,
                const datetime &time[],
                const double &open[],
                const double &high[],
                const double &low[],
                const double &close[],
                const long &tick_volume[],
                const long &volume[],
                const int &spread[])
{
// trying with CopyRates
//   MqlRates rates1[];
//   ArraySetAsSeries(rates1,true);
//
//   MqlRates rates2[];
//   ArraySetAsSeries(rates2,true);
//
//
//   CopyRates(Symbol(), PERIOD_M1, 0, rates_total, rates1);
//   CopyRates(Symbol(), PERIOD_M3, 0, rates_total, rates2);
//
//
//   for(int i = rates_total-1; i >= 0; i--){
//
//      //buf_a[i] = rates1[i].close;
//      //buf_b[i] = rates2[i].close;
//
//   }

   //using CopySeries
   CopySeries(Symbol(), PERIOD_M1, 0, rates_total, COPY_RATES_CLOSE, buf_a);
   CopySeries(Symbol(), PERIOD_M3, 0, rates_total, COPY_RATES_CLOSE, buf_b);


   return(rates_total);
}
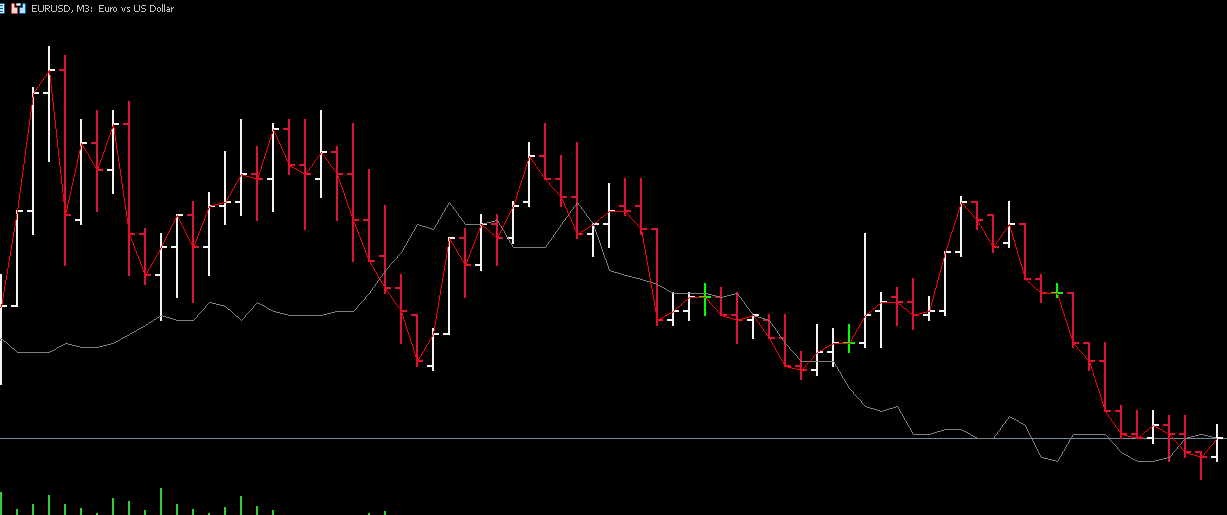
toggle to the M3 timeframe now, it won't work right if you view the chart on M1 timeframe

- www.mql5.com
I'm thinking you're heavily overcomplicating things. You should be able to do something with CopySeries
toggle to the M1 timeframe
Meh that would such an easy solution, really appreciate, I'm still trying to learn MQl5, however when I test the code , only the M1 line seems to get drawn on the chart, how do I get the M3 working.
//SOLVED
EDIT: Ooh I see I need to be on M3 for it to work, really appreciate your time.
Meh that would such an easy solution, really appreciate, I'm still trying to learn MQl5, however when I test the code , only the M1 line seems to get drawn on the chart, how do I get the M3 working.
ensure that you have this at the top:
#property indicator_buffers 2
#property indicator_plots   2
because there's 2 plots (for the 2 lines), it's an easy mistake to make to use the wrong number of buffers or plots
- Free trading apps
- Over 8,000 signals for copying
- Economic news for exploring financial markets
You agree to website policy and terms of use
Hello all, i'm new here, as the title says, (MT5) i'm trying to overlay an M3 line-chart onto an M1 line-chart by creating a custom indicator that uses M1 as the data source, however i've run into lots of problems, nothing gets draw even after initializing my buffers, any pointers in the right directions will be greatly appreciated: