Drawdown Graph Inconsistency in Signal Provider Performance
5.4% and 0.34% are different drawdown figures.
One is maximum drawdown and the ther one is live drawdown.
Forum on trading, automated trading systems and testing trading strategies
MY signal is showing a false drawdown level.
Eleni Anna Branou, 2022.03.18 17:38
Drawdown is not only the live drawdown of open trades, but also the account balance drawdown between high and low points.
You may never had more than a 3-4% live drawdown, but if you had 6-7 consecutive losses of 3%, that adds up to about 20% max drawdown.What the Numbers in the Expert Testing Report Mean
-
Absolute drawdown is the difference between the initial deposit and the smalles value of balance within testing:
AbsoluteDrawDown = InitialDeposit - MinimalBalance -
Maximal drawdown is the highest difference between one of local upper extremums of the balance graph and the following lower extremums:
MaximalDrawDown = Max of (Maximal Peak - next Minimal Peak)
The maximal drawdown percentage shows the ratio between the maximal drawdown and the value of respective local upper extremum:
MaxDrawDown % = MaxDrawDown / its MaxPeak * 100%

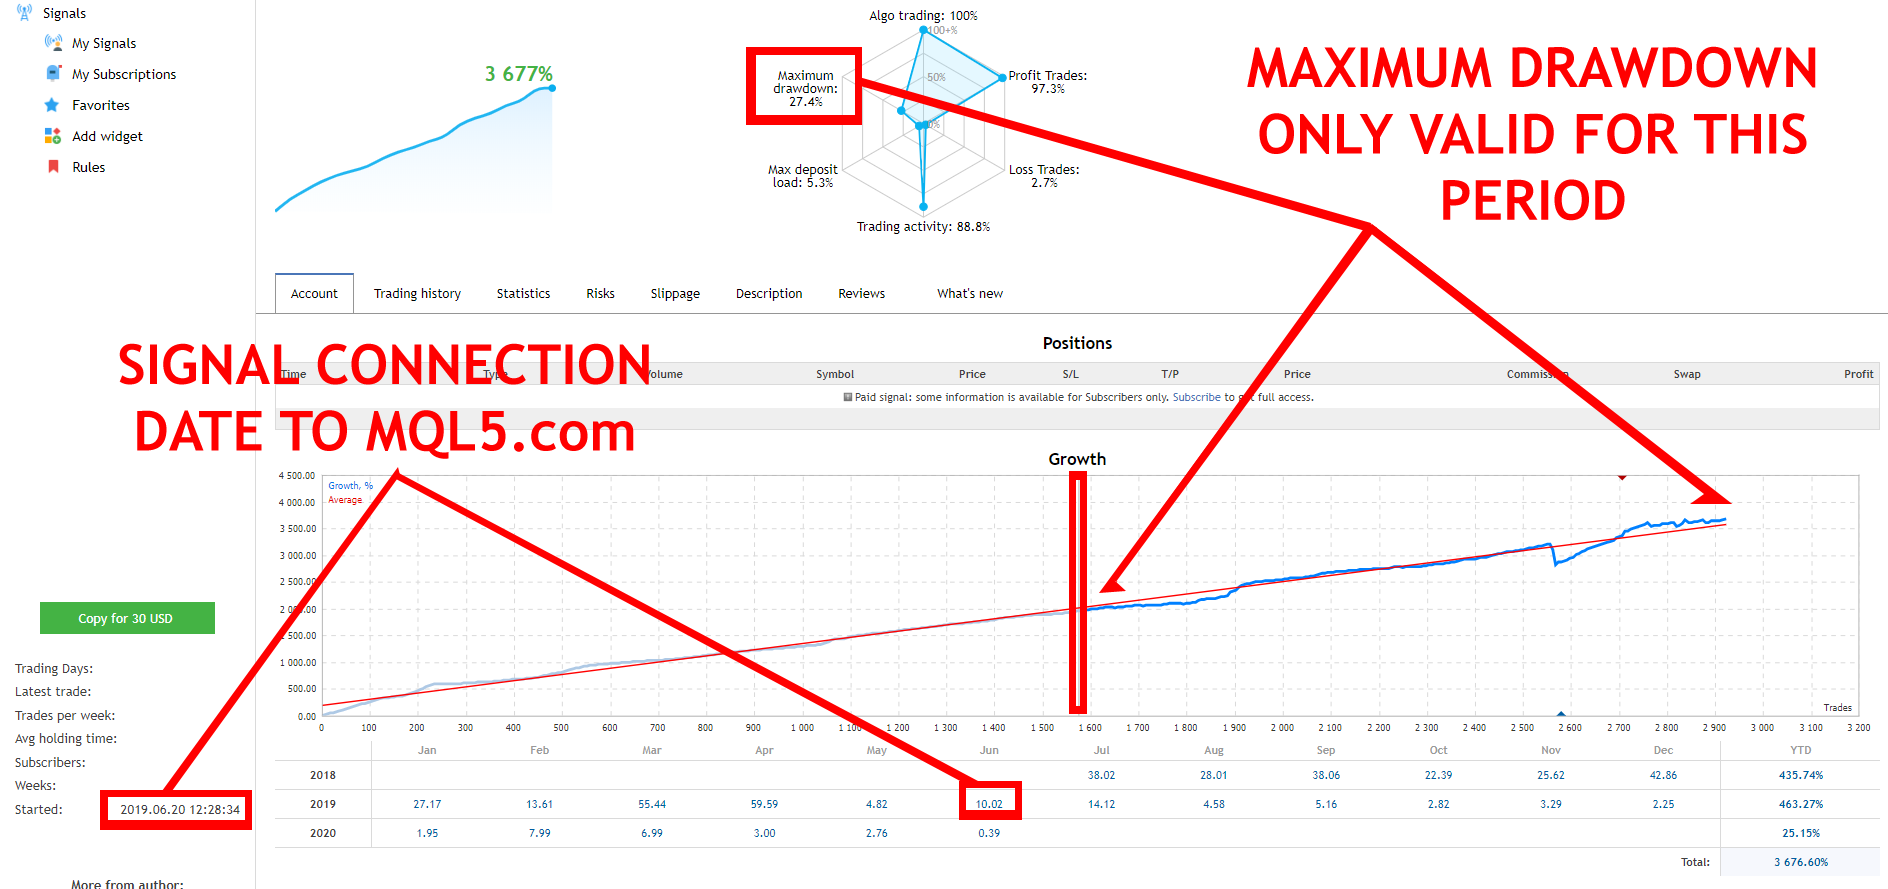
Also you should know that the Maximum Drawdown info is only valid since the signal has been published and connected to MQL5.com signals database and not since the beginning of the trading account.
- Free trading apps
- Over 8,000 signals for copying
- Economic news for exploring financial markets
You agree to website policy and terms of use
Why the drawdown graph only presents data for 24 weeks, not reflecting the stated maximum drawdown of 5.4% as per the account specification?