Problem with draw multi color lines
#property indicator_plots 16
It doesn't work...
According to the documentation I only need 8 plots for each drawn color line, the color buffer no needs to be counted as a plot but just the data buffer.
Anyway thanks for your answer.
As in the example reported in https://www.mql5.com/en/docs/customind/indicators_examples/draw_color_line PLOT_LABEL, PLOT_DRAW_TYPE, PLOT_LINE_STYLE, PLOT_LINE_WIDTH have to be applied to the INDICATOR_COLOR_INDEX buffers.

- www.mql5.com
Sorry, I got confused by the fact that you are applying PLOT_* properties also to the INDICATOR_DATA buffers in your void BasicInit().
As in the example reported in https://www.mql5.com/en/docs/customind/indicators_examples/draw_color_line PLOT_LABEL, PLOT_DRAW_TYPE, PLOT_LINE_STYLE, PLOT_LINE_WIDTH have to be applied to the INDICATOR_COLOR_INDEX buffers.
Thank you but it doesn't solve my issue, I have to find another way.
-
It is almost always your code.
How To Ask Questions The Smart Way. (2004)
Don't rush to claim that you have found a bug.
Questions Not To Ask
My program doesn't work. I think system facility X is broken. - Where do you define your lines with #property? Where in OnInit do you connect the lines to buffers?
-
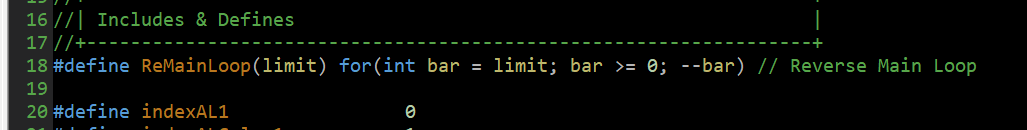
ReMainLoop(limit) {Do not post code that will not even compile.
Not sure if you have actually compiled and tested my code. In the picture I sent, I can still run it normally but it cannot display properly.
2. It is not necessary to define indicator properties using #property. I have defined it all in BasicInit() and ColorBufferInit() functions
3. I defined it on line 18, and the file I attached can still compile normally.
Why are you defining your colours (and other display properties) at runtime and with hard coded values?
Instead, use the "#property" to define the visual properties of the various plots.
Not only will it simplify your code, but will also allow the user to change the colours and other visual aspects to suit their preferences.
You are over-complicating things for yourself.
You're right, but this doesn't answer my question.
The problem here is that it doesn't display properly, not that it makes the program inflexible.
In fact, after loading the indicator into the chart, the user can still change the display properties.
But that in itself is an issue, because your code is "stringy" and "over complicated", making it difficult for us to read it and identify the issue. We also don't have the disposition to debug it for you either.
- Free trading apps
- Over 8,000 signals for copying
- Economic news for exploring financial markets
You agree to website policy and terms of use
Hi, I'm trying to draw 8 color lines with 8 buffer colors in one day, base on time range, but almost of them are not showed on the chart, it only shows 4 buffers on data window. I spent all day without finding the cause. Where did I go wrong? My code file attached below
The order of these buffers