Mt4 backtesting report green bars
The deposit load value shows the percent of account funds used to open positions. Load calculation formula:
Load = Margin / Equity * 100%
If the current account value is 10,000 USD, and the margin of open positions is 5,000 USD, the account load is 50% = 5,000 USD / 10,000 USD * 100%.
The deposit load value shows the percent of account funds used to open positions. Load calculation formula:
Load = Margin / Equity * 100%
If the current account value is 10,000 USD, and the margin of open positions is 5,000 USD, the account load is 50% = 5,000 USD / 10,000 USD * 100%.
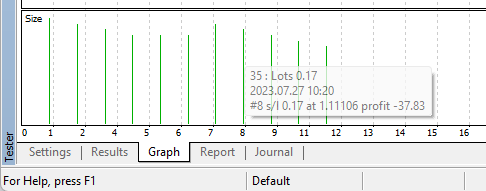
Thank you @Eleni , but this value is not clear on the mt4 backtesting apart displaying long greenbars which do not really tell you how much the account load %value is
From what i understand this value is the margin level %?
So out of the 2 backtesting report the one with the highest load should be considered the more risky strategy?
Sorry, what I said is totally wrong, I was carried away with the MT5 strategy tester I mainly use.
The green bar in the MT4 strategy tester is the lot size of the test trades, if you hover with your mouse you can see the lot size and some details of each trade.
The higher the bar, the larger the lot sizes in the test.
Thanks for the clarification on my second backtesting all the bar the same size , its just a big green line with each bar the same sized and the only lot size used is 0.01, trying to figure out why instead of displaying 1 single bar per trade its displaying a filled green line.
When the trades are too many, they don't distinguish from each other, so they appear as a single green block.
When the trades are too many, they don't distinguish from each other, so they appear as a single green block.
- Free trading apps
- Over 8,000 signals for copying
- Economic news for exploring financial markets
You agree to website policy and terms of use
Hello Guys
Just wondering i have backtested 2 strategies on the second screenshot representing the 2nd backtest strategy there is a long green bar which is supposed to represent what exactly? drawdown? What are the values?