forward testing is different from optimized back testing results...why?
i have made an ea which is showing very low drawdawn in backtesting with huge profits, but in forward testing with same inputs, its giving different results why so? how to properly backtest, i have done optimization too, but the in real live market the results are very different from backtesting
can anyone help me out???
Without the code and informations about the EA we cannot imagine what happened.
What I think is that you are using MT4, backtesting an EA that trades around midnight. On MT4 backtests use fixed spread, which is surely not a real thing and you probably used a too low value compared to the real one around these hours.
But of course this is only a supposition...
i have made an ea which is showing very low drawdawn in backtesting with huge profits, but in forward testing with same inputs, its giving different results why so? how to properly backtest, i have done optimization too, but the in real live market the results are very different from backtesting
can anyone help me out???
Probably, during the optimization process your expert advisor got "overfitted" to history data. This can easily happen if you only care about high balance outcomes during optimization. High profits during backtesting/optimization can be the result of a view lucky trades. To avoid "overfitting" it is better to choose a parameter setup which consistantly generates profits over time and in every market phase. To evaluate this you need a sufficient nummber of profitable trades with a proper risk management, distributed over a large timespan and diversified market structures.
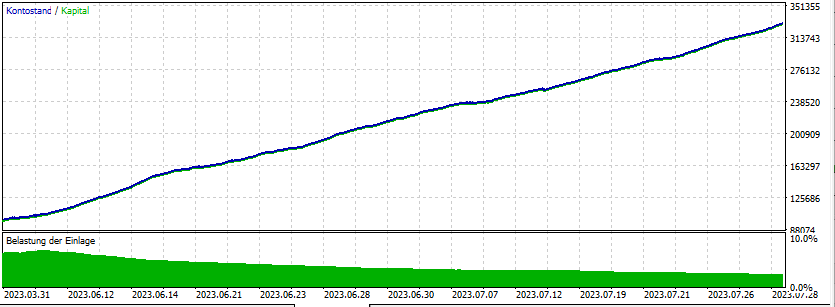
If a strategy can create a profit curve like this, I would call it reliable:
1. Enough trades to minimize the impact of "lucky shots" (In this case 11.427)
2. Good risk/reward ratio (Max Equity Drawdown 0.78%)
3. Good win rate (82.5%, but 10% would also be OK if you have the right Risk-Reward Ratio )
Result: Constant growth

- www.mql5.com
Probably, during the optimization process your expert advisor got "overfitted" to history data. This can easily happen if you only care about high balance outcomes during optimization. High profits during backtesting/optimization can be the result of a view lucky trades. To avoid "overfitting" it is better to choose a parameter setup which consistantly generates profits over time and in every market phase. To evaluate this you need a sufficient nummber of profitable trades with a proper risk management, distributed over a large timespan and diversified market structures.
If a strategy can create a profit curve like this, I would call it reliable:
1. Enough trades to minimize the impact of "lucky shots" (In this case 11.427)
2. Good risk/reward ratio (Max Equity Drawdown 0.78%)
3. Good win rate (82.5%, but 10% would also be OK if you have the right Risk-Reward Ratio )
Result: Constant growth
- Free trading apps
- Over 8,000 signals for copying
- Economic news for exploring financial markets
You agree to website policy and terms of use
can anyone help me out???