indicator that shows "activity" in the market
I been updating my indicators in resent time, I notice that I have successfully introduced, a model that shows volatility/Activity with numbers. so I want to know if its possible to see Volatility/Activity in Realtime..? if there is no Activity deviations of my numbers becomes stable. i want to know if there is way to see activity/imbalance in the market..?
- Activations
- How to buy a second license if all activations have been used?
- What do you think is the best indicator for making a profit.
Kyda BelRoch-Veldemo: I have successfully introduced, a model that shows volatility/Activity with numbers. so I want to know if its possible to see Volatility/Activity in Realtime..
Make up your mind. Either you did, or you did not.
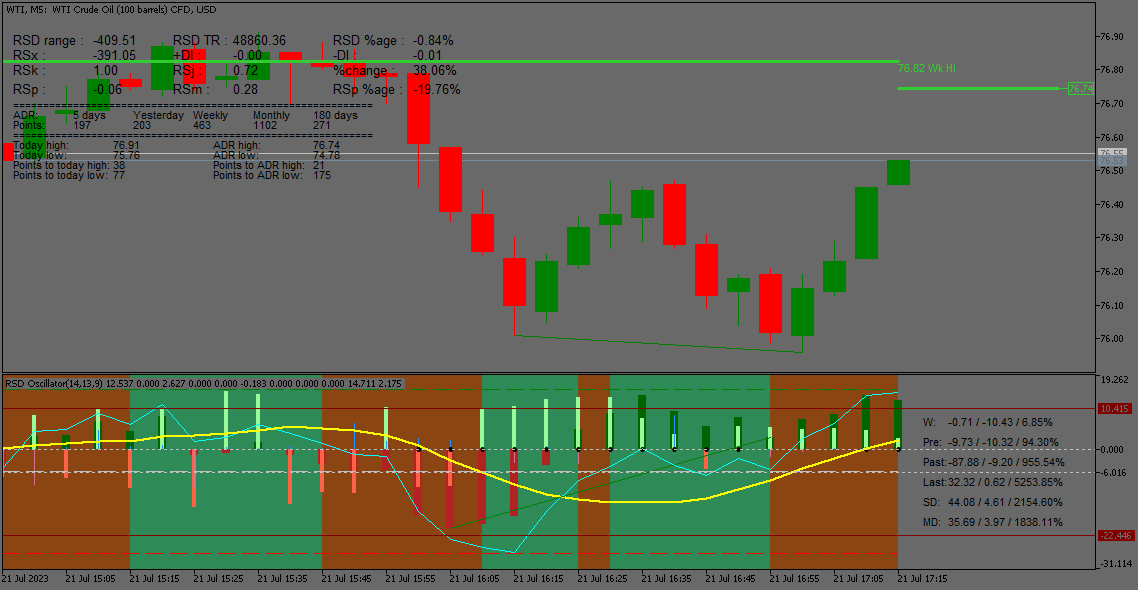
Here is the results of the indicator i been working on for sometimes, RSk shows maximum speed of current movement, while RSj shows speed of motion in time series. speed range from 0 to 1
if you look at the bottom right you will see blocks data in different time series(weekly, previous, past, last),
SD(Standard deviation), MD(Mean deviation), do you see deviation is increasing on the first block...? price will head to daily ADR High @ 76.74$, before it reverse because RSx is -391.05 points.
negative is directional, meaning the price will sell with a momentum of -0.06 points at %age of -19.76 points...
You might have to create custom functions which mathematically work out the activity and imbalances in the market, there's lots of functions at your disposal such as iTime() , iOpen() , iHigh() , iLow() , iClose() , and iVolume()
You are missing trading opportunities:
- Free trading apps
- Over 8,000 signals for copying
- Economic news for exploring financial markets
Registration
Log in
You agree to website policy and terms of use
If you do not have an account, please register