Drawing a different Currency Candles in indicator window
"DRAW_HISTOGRAM" works differently for "indicator_separate_window" than it does for "indicator_chart_window".
On "indicator_chart_window", it fills between two buffer values, but on " "indicator_separate_window" it always fills between the zero level and the buffer value.
To simulate candles, you will have to use another histogram to "paint" over it with the background colour.
The following example from the CodeBase may help you understand the concept:
Collector, 2006.10.16 10:23
The Renko charting method is thought to have acquired its name from "renga" which is the Japanese word for bricks.
In the chart window, histograms are drawn via pairs of buffers. If the first is higher than the second, it uses the first's color.
In a separate window, histograms are drawn from the buffer value to zero. They are drawn from the first to the last. If you want one to be the background, it must be the first buffer.
See also
How to Draw Cnadle chart in indicator_separate_window ? (XDXD) - MQL4 programming forum (2016)
- Free trading apps
- Over 8,000 signals for copying
- Economic news for exploring financial markets
You agree to website policy and terms of use
This is what it draws:
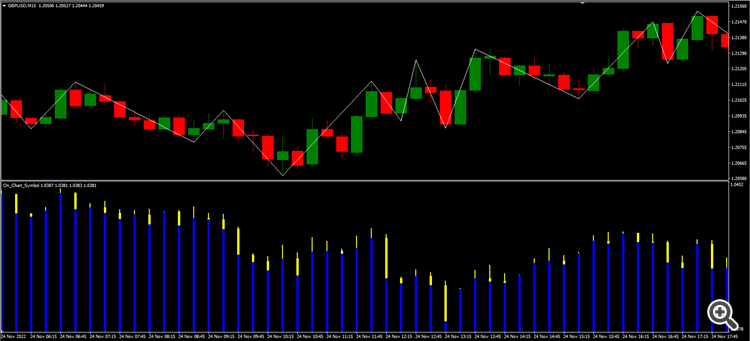
Looks nothing like a Candle and more like a Line with infinite low Price