How to Draw Cnadle chart in indicator_separate_window ?
I use ObjectCreate() to draw things in subwindows when Indicator Indexes don't do what I want.
Maybe you are right, but ObjectCreate() need int window, 0 is indicator_chart_window
How to find current indicator_separate_window ?
OK, I got,
| WindowOnDropped( | ) |
No. Use WindowFind()
no, WindowFind() is all Char window or main or chart window.
separate_window is sub-window, need
| WindowOnDropped( | ) |
| int WindowFind( | string name) |
| name | - | Indicator short name. |
| int WindowFind( | string name) |
| name | - | Indicator short name. |
I found something which was ALMOST useful in a way to get bars in a separate window from the histogram.
If you run the indicator with:-
#property indicator_separate_window as the initial setting,
then the histogram starts at the 0 line. (which is NOT what we want)
Then you edit the indicator and change the setting to :-
#property indicator_chart_window
And the previous histogram becomes (just like it shows in the main chart) a BAR histogram.
But it needs to be done manually each time and can't be done in code directly.
Now if you put :-
#property indicator_chart_window
#property indicator_separate_window
Unfortunately only the first line of code gets used.
There is obviously an internal variable in Mt4 that we need to change to get it to do the bars in a separate window, but I have no clue how to discover if we can change it.
In the end, I too end up loop drawing Trend lines as bars. (you end up with thousands of them, but it doesnt seem to hassle the speed much in backtesting.
BlueMental.
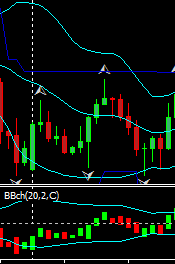
in indicator_separate_window , DRAW_HISTOGRAM use 0 as base to draw HISTOGRAM.
in indicator_chart_window, DRAW_HISTOGRAM use another buffer as base to draw HISTOGRAM.
how to draw candle chart in indicator_separate_window like it in indicator_chart_window?
#property indicator_type1   DRAW_HISTOGRAM
#property indicator_color1  clrLime
double abHigh[];
#property indicator_type2   DRAW_HISTOGRAM
#property indicator_color2  clrRed
double abLow[];
#property indicator_type3   DRAW_HISTOGRAM
double hideAbove[];
#property indicator_color4  clrLime
#property indicator_type4   DRAW_HISTOGRAM
double beHigh[];
#property indicator_color5  clrRed
#property indicator_type5   DRAW_HISTOGRAM
double beLow[];
#property indicator_type6   DRAW_HISTOGRAM
double hideBelow[];
int OnInit(){
   color bg     = (color) ChartGetInteger(0, CHART_COLOR_BACKGROUND);
   width        = (int)   ChartGetInteger(0,CHART_SCALE);
//--- indicator buffers mapping
   SetIndexBuffer(0,abHigh);     SetIndexLabel(0,NULL);
                                 SetIndexStyle(0, DRAW_HISTOGRAM, EMPTY, width);
   SetIndexBuffer(1,abLow);      SetIndexLabel(1,NULL);
                                 SetIndexStyle(1, DRAW_HISTOGRAM, EMPTY, width);
   SetIndexBuffer(2,hideAbove);  SetIndexLabel(2,NULL);
                                 SetIndexStyle(2, DRAW_HISTOGRAM, EMPTY, width,
                                                  bg);
:
int OnCalculate(...){
   if(ChartGetInteger(0,CHART_SCALE) != width)  OnInit();
   for(int iBar = Bars - 1 - MathMax(LOOKBACK, counted); iBar >= 0; --iBar){
      :
      if(hi > 0.0){
         if(op < cl){
            abHigh[iBar]   =  hi;
            hideAbove[iBar]= abLow[iBar]  =  MathMax(0.0, lo);
         } else{
            hideAbove[iBar]= abHigh[iBar] =  MathMax(0.0, lo);
            abLow[iBar]    =  hi;
         }
      }
      if(lo < 0.0){
         if(op > cl){
            hideBelow[iBar]= beHigh[iBar] =  MathMin(0.0, hi);
            beLow[iBar]    = lo;
         } else{
            beHigh[iBar]   = lo;
            hideBelow[iBar]= beLow[iBar]     =  MathMin(0.0, hi);
         }
      }
  }   // for
Nice work Mr. Roeder... You make the histogram same color as background to 'hide' it and also I like the trick of using the MathMax in the establishment of the iBar variable in the for loop after assigning the constant LOOKBACK to the Period.... nice coding lesson for those who will take the time to download and study it line by line... I'm sure many will benefit from this example. Thanks...
Jimdandy: also I like the trick of using the MathMax in the establishment of the iBar variable in the for loop after assigning the constant LOOKBACK to the Period....
| How to do your lookbacks correctly. |
- Free trading apps
- Over 8,000 signals for copying
- Economic news for exploring financial markets
You agree to website policy and terms of use
in indicator_separate_window , DRAW_HISTOGRAM use 0 as base to draw HISTOGRAM.
in indicator_chart_window, DRAW_HISTOGRAM use another buffer as base to draw HISTOGRAM.
how to draw candle chart in indicator_separate_window like it in indicator_chart_window?
And how to code in codes to receive same effect of
#property indicator_minimum xxx
#property indicator_maximum xxxx
?
not all #property can be set with function SetIndexXXX !!!
And in indicator_separate_window, EMPTY and EMPTY_VALUE, are also effect, so how to draw 3 color indicator in indicator_separate_window ?